Quantcast
Channel: 60East Technologies
Viewing all 62 articles
Browse latest View live

60East Launches Media Division with the World’s Most Advanced ASCII Movie Player!

$
0
0

ASCII Buster Keaton


60East Technologies is thrilled to launch the world’s most advanced online ASCII movie service, http://asciiflix.com. The first project of the new 60East Media Division, this new service leverages the precision and parallelism of 60East’s Advanced Message Processing System (AMPS), using the transaction log replay and State-of-the-World functionality to deliver the most advanced media experience ever seen by humankind.

“We’ve been following the revival of vinyl’s popularity among those with the most discerning hearing and waiting for the perfect opportunity to bring the same sort of high-fidelity, old-school precision to fans of movies.”, says Brand Hunt, one of the company’s founders. He continues, “With [asciiflix.com] we’re really pushing the envelope of what’s capable over the web. YouTube is working on 8K video and it’s spectacular, but it can’t tickle the retinas of hipsters like 8 color, 7-bit ASCII can.”

One anonymous analyst said, “With [asciiflix.com]’s focus on CC0 and silent movies, they could be a unicorn within 18 months if they can keep the network distribution costs down. No one else is doing anything like this – it’s completely different.”

60East media division also announced plans for two ground-breaking technologies on top of the service next month:

  • NO-Ctm Advertising Ads are spliced into the movies where it’s difficult for the viewer to notice they’re watching advertising. Based on Dr. Julia Eyelidminder’s work at the University of Chicago Starbucks, 99% of the viewers are completely unaware that they’ve even seen an advertisement. This is a stark contrast to other ad delivery systems where it’s immediately obvious to a viewer that they are watching an ad.

  • VT100 Support Proprietary dithering algorithms, based on the work of Floyd and Steinberg, and offered through the real-time aggregation system of AMPS, the service can tap into the device renaissance and extend the use into devices from the 1970’s, while still being able to please viewers on modern mobile devices. (VT52 support is planned for late next year.)

Detail of ASCII Buster Keaton

The technology behind ASCIIFlix is nothing short of groundbreaking. Each frame of the video is stored as an individual message within an AMPS server. Viewer applications simply replay the message stream to watch the video. Full support for bookmark replays means that a viewer can pause video at any point, and even lets an application save favorite scenes for later reference.

Delivering the video service on top of AMPS allows unheard of scale and precision of frame delivery with minimal buffering on the client side. This is ideal for viewing ASCII videos on small, underpowered IoT devices or decade old terminals.

As of launch time, the service offers viewers classic movies such as The General, starring Buster Keaton, or delightful short films such as Peach Bird and Man Typing on a Keyboard. Enjoy now, while it’s still free! Just go to http://asciiflix.com and sit back (way back… further… no, really, it looks better if you’re not so close) and enjoy the movies!


Preprocessing and Enrichment

$
0
0

medieval writing desk


In AMPS 5.2, we’ve introduced a new set of capabilites for modifying messages as they are published to AMPS: Message Preprocessing and Message Enrichment. Both features are configured in your AMPS configuration file, on the individual SOW Topics where you would like to use them. These new capabilities can streamline applications that need complex message flows, producing higher perfomance and easier administration.

Here is a brief example of configuring Preprocessing and Enrichment on a SOW topic Orders, to both add a new field and validate existing fields:

<SOW><Topic><Name>Orders</Name><MessageType>json</MessageType><Preprocessing><Field>CONCAT(/customer_id,"-",/order_id) as /order_key</Field></Preprocessing><Key>/order_key</Key><Enrichment><Field>IF(/qty &lt; 0, /qty OF PREVIOUS, /qty) as /qty</Field><Field>IF(/price &lt; 0, /price OF PREVIOUS, /price) as /price</Field></Enrichment></Topic></SOW>

With this configuration, a message published to AMPS that looks like this:

{"customer_id":"A-111","order_id":1000,"qty":-1,"price":100}

Will be transformed into the following before it is stored in the AMPS SOW, written to the transaction log, or delivered to subscribers:

{"customer_id":"A-111","order_id":1000,"order_key":"A-111-1000","qty":null,"price":100}

Note the new Enrichment and Preprocessing elements in this SOW topic definition. If you have used AMPS Views before, the syntax of each of these features may seem familiar: you define one or more Field elements based on AMPS expressions using a SQL-like syntax to define the content of each field.

Unlike View projections, enrichments and preprocessing are evaluated as you publish a message into the SOW. The message received by AMPS is amended or changed based on the preprocessing and enrichment rules defined in your configuration file. The altered message is the one stored in the SOW and sent to subscribers.

Preprocessing versus Enrichment

Preprocessing and Enrichment are very similar but run at different stages of message processing, allowing you to accomplish unique things with each. Here’s an abstract outline of when these steps occur:

here

Preprocessing occurs before we evaluate the message’s SOW key. This means you can use preprocessing to clean or trim the message’s key fields before we use them. In the above example, we compute a brand-new field /customer_key which is then used as the SOW key of the message.

Enrichment runs later in message processing, after the SOW key has been located and we can load the existing message in the topic for that key, if any. If the publish was a delta_publish we merge the message into the existing one as expected, but the previous values for that record are available to enrichment fields via a new OF PREVIOUS syntax.

OF PREVIOUS allows Enrichment rules to use the previous values in a message as part of enriching a new message. In the above example, we use OF PREVIOUS to ensure /qty and /previous are not updated to values < 0, and default them to whatever they were previously. The rule validates that the newly supplied /qty value is not less than 0. If it is, the IF clause evaluates to the previous value of /qty for that record, and the /qty field in the updated message has the value of /qty from the previous record. Enrichments are a powerful tool for implementing data quality rules that cannot be implemented at the publisher, since the publisher may not have access to the entire state of the record.

Uses

Preprocessing and Enrichment are useful for computing new fields and validating or changing existing ones. Here’s a few ideas of how you might be able to use them:

  • Use Preprocessing rules to construct unique SOW keys when publishers do not provide suitable values.
  • Enforce business logic/business rules for important fields at the server with Preprocessing and/or Enrichment.
  • Allow or reject different types of updates to a record based on that
    record’s other fields (for example, a state field on an order might be used to determine whether the price can still be modified.)

More

Additional options exist on Enrichment and Preprocessing for (optionally) removing fields from a message if desired, and for controlling the order of execution of individual Fields. For more on these options and on everything else you can do with Preprocessing and Enrichment, visit the Enrichment Chapter of our User Guide!

Crank Up Apache Flume

$
0
0

1960's era wooden logging flume with water running in it

60East customers often integrate their AMPS deployments with the wider ecosystem of cloud storage providers, text search and analysis platforms, and the Apache ecosystem of big data tools such as Spark and Hadoop. One common integration request is the ability to pull an AMPS message stream directly into Apache Flume so that messages can be easily routed to HBASE, Hive, Amazon S3 or Elastic Search for further analysis or processing.

AMPS provides sophisticated message processing capabilities that complement Flume in an end-to-end system. AMPS inline enrichment and powerful analytics and aggregation (including aggregation of disparate message formats) make it easy to provide processed and enriched data to the destination system. AMPS also provides high-performance content filtering to precisely identify messages of interest, reducing network overhead, storage requirements, and processing time for the destination system. Even better, AMPS provides conflation, paced replay, and resumable subscriptions so that the destination system is never overwhelmed with the volume of incoming messages, and can be populated even in the case of a network outage, planned maintenance, or a failure in a component.


Today, we’re making this integration easier by releasing a custom AMPS source for Apache Flume NG.

Apache Flume NG

To paraphrase Apache’s project page, Apache Flume NG (simply “Flume” or “Apache Flume” below) is a distributed and reliable service for collecting and aggregating large amounts of data. The “data” routed through Flume can be anything that is adapted to fit Flume’s Event abstraction, which is the basic data unit in Flume. Use cases for Flume include social media, trades/executions, and IoT sensor/geo-location data, as well as logging events.

Flume is typically run on one or more machines, with each Flume Java process executing a Flume Agent. A Flume Agent is configured to have one or more “sources” that pull in data from various systems. Sources write data to one or more configured “channels”, which usually provide transactional integrity (depending on type). Channels can be configured to have one or more “sinks” that drain their channel of data and write it to some destination system.

Figure 1: AMPS to Flume Integration

Flume comes with a variety of built-in source types for importing data from various data sources, such as a generic NetCat source for setting up a network listener socket, to more specialized sources for pulling in data from Syslogs, JMS, Twitter; or in specific data formats such as Avro or Thrift.

Flume channels come in a variety of types as well, from the simple and fast (but non-transactional and non-durable) Memory Channel, to slower reliable options that provide transactional guarantees such as a File Channel or JDBC Channel (for committing to any relational database that provides a JDBC driver).

Similar to sources and channels, Flume also provides various built-in sink types. These include sinks for writing to the Flume log file (Logger Sink), for writing events to a rolling series of files in a specified filesystem directory (File Roll Sink), and by far its most popular sink, the HDFS Sink, for writing events to the Hadoop Filesystem for downstream batch processing by big data systems such as Apache Hadoop or Apache Spark.

Flume also provides the means for third parties to implement their own custom implementations of sources, channels, and sinks, to suit specific needs. For example, connecting to AMPS.

The AMPS Flume Source

Flume’s ability to be extended with custom implementations of its components is where the subject of this blog comes in. 60East has released a Flume source capable of pulling in messages from an AMPS subscription and committing those messages to whatever channels the source is attached to in the Flume configuration.

The custom AMPS source implements a “pollable” Flume source by sub-classing org.apache.flume.source.AbstractPollableSource. This allows the AMPS client created inside the source to read messages from an AMPS subscription and batch them up, committing them to all the channels attached to the source whenever Flume polls the source. This approach is far more desirable from a performance perspective than an event-driven source that commits each message as the message arrives: that approach incurs channel transaction costs on a per message basis.

Getting Started

To get started you will need at least a Java 7 JDK, Maven 3.3, and Apache Flume NG 1.7.0. First clone the AMPS Flume source repository from GitHub:

git clone git@github.com:60East/amps-integration-apache-flume.git amps-flume

Follow the build and installation instructions in the README.md file located in the cloned directory (also available under https://github.com/60East/amps-integration-apache-flume ). This will walk you through building the AMPS Flume source JAR and how to install it as a plugin in your Apache Flume installation.

Once you have the AMPS source installed as a plugin, you can use it within your Flume configuration. Below is an example configuration for an AMPS Flume source:

# Example config for an AMPS Flume Source
agent.sources.amps.type = com.crankuptheamps.flume.AMPSFlumeSource
agent.sources.amps.clientFactoryClass = com.crankuptheamps.flume.AMPSBasicClientFunction
agent.sources.amps.clientName = FlumeClient
agent.sources.amps.bookmarkLog =# For one AMPS server, you can just specify "uri".# For multiple HA AMPS servers, specify multiple URIs with an index number.
agent.sources.amps.uri1 = tcp://server1:9007/amps/json
agent.sources.amps.uri2 = tcp://server2:9007/amps/json
agent.sources.amps.command = sow_and_subscribe
agent.sources.amps.topic = Orders
agent.sources.amps.filter = /symbol IN ('IBM', 'MSFT')
agent.sources.amps.options =projection=[/symbol,avg(/price) as /avg_price,\
    avg(/price*/qty) as /avg_total],grouping=[/symbol],conflation=1s
agent.sources.amps.subscriptionId = Sub-100
agent.sources.amps.maxBuffers = 10
# maxBatch must be <= the smallest transactionCapacity of all channels# configured on the source.
agent.sources.amps.maxBatch = 1000
agent.sources.amps.pruneTimeThreshold = 300000

Here we’re configuring a Flume agent called agent, as can be seen above in the configuration key prefix. Under agent’s sources we have configured our source to be called amps. The type of any AMPS source must be the class com.crankuptheamps.flume.AMPSFlumeSource. This is the class from our Apache Flume integration repository that implements our custom AMPS source.

Client Settings

The clientFactoryClass configuration key is optional. By default it will use the built-in implementation, com.crankuptheamps.flume.AMPSBasicClientFunction, which will make use of the clientName, bookmarkLog, and uri[n] configuration keys to create an AMPS HAClient instance. If you have need of customizing the AMPS client creation process, such as to use a custom AMPS authenticator, a custom server chooser, or even a custom HAClient sub-class, you can create your own AMPS client factory by implementing the SerializableFunction<Properties, Client> interface from the AMPS 5.2.0.0 Java client. See the source code of com.crankuptheamps.flume.AMPSBasicClientFunction for an example of this. You would then need to package your client factory class inside AMPSFlumeSource-1.0.0-SNAPSHOT.jar, or in your own JAR that is placed in the $FLUME_HOME/AMPSFlume/libext/ directory. Then just specify your client factory’s fully qualified class name as the value of the clientFactoryClass configuration key.

The clientName configuration key is required and like any AMPS client name, it must be unique across all AMPS clients connecting to a high availability (HA) cluster.

The bookmarkLog configuration key is used to specify the absolute or relative path to the bookmark store log file. This configuration key is optional. If this is specified, the source will create a bookmark subscription for reliability purposes. The default client factory implementation will always use a LoggedBookmarkStore implementation on the client it creates when this key is specified.

The uri configuration key is required. It is used to specify one or more AMPS server transport URIs that you would like the AMPS client to connect to. If you only have a single AMPS server you want to connect to, the key may be specified as either uri or uri1. If you want to specify multiple AMPS servers in an HA cluster, each transport URI should be specified with an index number, starting with “1” and having no gaps. For example, uri1, uri2, and uri3 for three URIs.

Subscription Settings

The command configuration key is optional. If not specified its value defaults to subscribe for an ordinary subscription, though you could also specify values such as delta_subscribe, sow_and_subscribe or sow_and_delta_subscribe. In our example we are using the sow_and_subscribe command to query the State of the World (SOW) database topic and then subscribe to it for future updates.

The topic configuration key is required. This is the topic used in the AMPS subscription. Like any AMPS subscription, this may be a valid regular expression to allow subscribing to multiple topics.

The filter configuration key is optional. This is the filter expression used on the AMPS subscription. Our example here will filter incoming messages to just those with /symbol values of IBM or MSFT.

The options configuration key is optional. These are the options to be used on the AMPS subscription. In our example here we are using the new AMP 5.2 aggregated subscription feature to group the data by /symbol and project calculated view fields. We are also using a conflation interval of 1 second to collect all updates to the topic within a second and only send our Flume client at most one update per a second.

The subscriptionId configuration key is used to specify the subscription Id for a bookmark subscription, so when Flume is restarted it can recover from the bookmark log and continue the subscription where it left off. This should be unique amongst all subscriptions in the application. If the bookmarkLog configuration key is specified, then this is required, otherwise it’s optional.

Tuning Settings

The maxBuffers and maxBatch configuration keys control the batching of AMPS messages that are committed to the channel(s). They are both optional and have default values of 10 and 1000 respectively. These can be tuned to trade-off performance verses memory usage of the AMPS source. The maxBuffers key determines the maximum number of AMPS message buffers the source will queue up in memory before pausing to let Flume sinks catch up in draining attached channels.

The maxBatch configuration key is the maximum number of AMPS messages allowed inside a message buffer. This is the maximum batch size that will be committed to all attached Flume channels. As such, this value MUST be less than or equal to the transactionCapacity of every channel attached to the source, or you will always get channel commit errors (ChannelException) in the Flume log and no messages will ever reach attached channels or sinks.

If you multiply maxBuffers and maxBatch you will get the maximum number of AMPS messages held in source memory waiting to be committed to all attached channels. If sinks don’t drain attached channels fast enough, this limit will be reached and you will see this warning in the Flume log:

Pausing AMPS message processing to let Flume source polling catch-up.
Consider increasing maxBuffers; or maxBatch and the transaction
capacity of your Flume channel(s).

If the source uses a bookmark subscription, the AMPS Flume source doesn’t discard any AMPS message in the bookmark store until it has been committed to all channels attached to the source. So if a Flume agent suddenly goes down with thousands of messages batched in memory, upon restart the subscription will be recovered from the bookmark log and all messages that haven’t been marked as discarded will be redelivered to the AMPS source. For each batch, there is a small window between the time Flume indicates that attached channels are successfully committed and when bookmark store discards take place. If an outage occurs in this window, then all or some of the committed messages will be redelivered upon restart (though messages will always be in the proper order for a given publisher and there will be no gaps). This means that the AMPS Flume source provides at-least-once delivery semantics for bookmark subscriptions.

The pruneTimeThreshold configuration key is optional and has a default value of 300,000 milliseconds (5 minutes). This key determines the minimum amount of time that must elapse before the client’s LoggedBookmarkStore will be pruned of obsolete entries. The elapsed time is measured from the source’s start-up time or from when the last prune operation was performed. For debugging and testing purposes, this value can be set to zero to turn off all pruning (NOT recommended for general production use). The LoggedBookmarkStore will also be pruned upon normal Flume shutdown, unless this value is zero. If a custom client factory installs another bookmark store implementation on the client, then this configuration key has no effect.

Cranking It Up

Included in the project repository is a working example that shows off the powerful new aggregated subscription feature of AMPS 5.2 (for more info see our blog post on aggregated subscriptions).

Go to your cloned GitHub repository directory. Copy the example Flume configuration file to your Flume 1.7 installation:

cp src/test/resources/flume-conf.properties $FLUME_HOME/conf/

Be sure to rename the file if you already have a config file by the same name.

Next, start an AMPS 5.2 server instance with the included AMPS config file at: src/test/resources/amps-config.xml

Create a directory at /tmp/amps-flume/ to hold the event output of Flume:

mkdir /tmp/amps-flume/

Now start Flume from your $FLUME_HOME directory:

bin/flume-ng agent -Xmx512m -c conf/ -f conf/flume-conf.properties -n agent -Dflume.root.logger=INFO,console

Lastly, publish the example JSON messages to the Orders topic using the AMPS spark utility:

spark publish -server localhost:9007 -topic Orders -rate 1 -file src/test/resources/messages.json

Notice that we are publishing at a rate of 1 message per a second, so that in the output we can see the aggregate fields change over time as updates arrive.

These are the 15 messages we are publishing:

{"order_key":1, "symbol":"MSFT", "price":62.15, "qty":100}{"order_key":2, "symbol":"MSFT", "price":62.22, "qty":110}{"order_key":3, "symbol":"IBM", "price":180.40, "qty":125}{"order_key":4, "symbol":"FIZZ", "price":61.77, "qty":4000}{"order_key":5, "symbol":"YUM", "price":64.07, "qty":123}{"order_key":6, "symbol":"IBM", "price":181.02, "qty":200}{"order_key":7, "symbol":"FIZZ", "price":61.45, "qty":2300}{"order_key":8, "symbol":"MSFT", "price":62.52, "qty":1000}{"order_key":9, "symbol":"IBM", "price":180.90, "qty":750}{"order_key":10, "symbol":"MSFT", "price":62.45, "qty":900}{"order_key":11, "symbol":"YUM", "price":64.11, "qty":460}{"order_key":12, "symbol":"IBM", "price":180.85, "qty":150}{"order_key":13, "symbol":"FIZZ", "price":61.50, "qty":600}{"order_key":14, "symbol":"MSFT", "price":62.70, "qty":1200}{"order_key":15, "symbol":"IBM", "price":180.95, "qty":480}

After about 15 seconds (due to our 1 second rate of publishing and our 1 second conflation interval) our aggregated subscription view of the data gives us the following results under /tmp/amps-flume/:

{"symbol":"MSFT","avg_price":62.15,"avg_total":6215.0}{"symbol":"MSFT","avg_price":62.185,"avg_total":6529.6}{"symbol":"IBM","avg_price":180.4,"avg_total":22550.0}{"symbol":"IBM","avg_price":180.71,"avg_total":29377.0}{"symbol":"MSFT","avg_price":62.2966666666667,"avg_total":25193.0666666667}{"symbol":"IBM","avg_price":180.773333333333,"avg_total":64809.6666666667}{"symbol":"MSFT","avg_price":62.335,"avg_total":32946.05}{"symbol":"IBM","avg_price":180.7925,"avg_total":55389.125}{"symbol":"MSFT","avg_price":62.408,"avg_total":41404.84}{"symbol":"IBM","avg_price":180.824,"avg_total":61682.5}

For cases where the entire raw message stream is desired at maximum throughput, you would use a subscribe command and wouldn’t specify options such as projection, grouping, or conflation. For reliability and restart recovery, you would need to then specify the bookmarkLog configuration key to use a bookmark subscription.

Conclusion

Importing an AMPS message stream into Flume used to require intermediate steps and third party software. Now integrating AMPS with Apache Flume has never been easier. The new AMPS Flume source allows you to plug an AMPS subscription directly into a Flume flow.

How do you plan to use the Flume integration? Would you like to see AMPS connected to other software stacks – either as a sink or source? Let us know in the comments!

Hot, Fresh, and Expressive: New AMPS Functions!

$
0
0

Microphone. image by drestwn -- CC BY 2.0AMPS 5.2 has dropped and, like a new Beyonce album, it is so awesome it will probably break the internet. AMPS 5.2 comes with a mind bending amount of new functionality, but I would like to focus on a few key new functions that have been made available to your AMPS expressions.

Functions are like the backup singers of the AMPS world: they may not be what you hear first, but they sweeten the mix and you’d miss them if they weren’t there.

First, a quick review. A key piece of the AMPS workflow is a full featured expression language that is based on XPath and SQL-92. This language is used for:

  • Content filtering
    • for client subscriptions
    • for server configuration settings such as actions
    • for filtered (content-aware) entitlements
  • Creating projected fields for views
  • Constructing fields for message enrichment (Another exciting new feature of AMPS 5.2)

If you have used AMPS, you have probably used the AMPS expression language. The AMPS expression language exposes a range of functions that allow you to do computations on your message data right inside the system, with very high performance.

These include familiar string query functions such as:

  • SUBSTR()
  • INSTR()

as well as the numeric aggregation functions:

  • AVG()
  • COUNT()
  • MIN()
  • MAX()
  • SUM()

These functions provide a lot of utility, but we weren’t satisfied! AMPS 5.2 has greatly expanded the amount of built in functions available to you in your AMPS expressions. There are now 13 new functions available to for use in your AMPS expressions.

Let me break them down for you:

Numeric Operations:

Let’s start with the most straight forward additions. These are numeric functions that will make it just a little bit easier to tailer AMPS expressions for your use case without extra effort.

FunctionDescription
ROUND()rounds values to the nearest integer, or to the nearest specified decimal place if one is specified.
ABS()Returns the absolute value of a number.

String Operations:

String processing is an important part of a good messaging system, so we created quite a few new string functions. I’m going to break them down by sub-category to more clearly show their utility:

Search and Replace

FunctionDescription
REPLACE()Search and replace all occurences of a string and return the resulting string.
REGEXP_REPLACE()Search and replace all occurences of a regular expression and return the resulting string.

Search and Case Sensitivity

Previous versions of AMPS required you to use to regular expressions if you wanted to handle case-insenstive matching. Regular expressions are very powerful but come with a large amount of complexity. AMPS 5.2 gives you new tools that allow you to provide case insenstive matching without resorting to the “big guns” inside regular expression matching.

Starting with:

FunctionDescription
INSTR_I()Case-insensitive, Returns the position at which the second string starts, or 0 if the second string does not occur within the first string.
STREQUAL_I()Case-insensitive, Returns true if, when both strings are transformed to the same case, the string to be compared is identical to the string to compare.

These are exactly like their case-sensitive counterparts from previous versions of AMPS, with the very useful distinction that they ignore case. The addition of those functions are theoretically enough to handle most string case related issues, but the AMPS team did not stop there! We wanted to provide you maximum flexibility.

In some cases, particularly when using strings with the IN clause, it is more efficient to simply convert the string to a known case. This is why we introduced:

FunctionDescription
UPPER()provide the ability to convert ASCII strings to their upper case equivalents.
LOWER()provide the ability to convert ASCII strings to their lower case equivalents.

One final note about these string functions. It’s important to point out that these functions are NOT unicode-aware.

Concatenation

I would like to take a moment to talk about CONCAT, because it is particularly flexible and powerful. The function accepts both XPath identifiers and literal values and will return a string composed of all of them. CONCAT also works with non-string values, and will attempt to convert them to strings using the normal AMPS string coercion rules.

FunctionDescription
CONCAT()Allows concatenating the string representations of one or more fields into a single string value. CONCAT may be called with any number of arguments.

CONCAT() is be very useful for debugging or status message generation, but it can also be used in more clever ways. For example, you can create a unique record id for a view that is composed of two different underlying topics:

<ViewDefinition><Topic>MechaGodzilla</Topic><UnderlyingTopic><Join>/GiantRobots/body_part = /GiantMonsters/body_part</Join></UnderlyingTopic><MessageType>json</MessageType><Projection><Field>CONCAT(/GiantRobots/part_id, /GiantMonsters/monster_id)
                   AS /cyborg_id</Field><Field>CONCAT("Mecha", /GiantMonsters/monster_name)
                  AS /monster_name</Field></Projection><Grouping><Field>/GiantRobots/part_id</Field><Field>/GiantMonsters/monster_id</Field></Grouping></ViewDefinition>

Filtering

AMPS 5.2 has added one very important filtering function:

FunctionDescription
COALESCE()returns the first non-NULL argument. COALESCE may be called with any number of arguments.

COALESCE() takes a list of field identifiers, and returns the first one that is not Null. This can be used in several powerful ways. By using COALESCE() in your views, you can create very fine grained aggregated fields. For example:

COALESCE(/userCategory,/employeeCategory,/vendorCategory,'restricted')

COALESCE() can be used as a cleaner alternative to IF chaining. For example, you may want to determine a total for an order, but it may have several possible values for a price. In older versions of AMPS you would write the expression like this:

/Order.Qty*IF(/Order/NormalPriceISNOTNULL,/Order/NormalPrice,IF(/Order/SpecialPriceISNOTNULL,/Order/SpecialPrice,IF(/Order/SuperFriendsDiscount,/Order/SuperFriendsDiscount,0)))

With COALESCE() in AMPS 5.2, you can simply write:

/Order/Qty*COALESCE(/Order/NormalPrice,/Order/SpecialPrice,/Order/SuperFriendsDiscount,0)

Here are a few tips for working with COALESCE(). First, notice that, to make the intent of the filter clear, this example provides a constant value for AMPS to return from the COALESCE if all of the field values are NULL.

Second, note that COALESCE() is a scalar function. It takes a list of scalar values or scalar valued fields. This means that arrays will get converted to “scalar context”! In the most simple terms this means that COALESCE() will use the first value of the array as the value, and ignore the rest of the array.

AGGREGATION

For all of you data scientists out there, AMPS 5.2 provides a few new functions that you are going to love:

FunctionDescription
COUNT_DISTINCT()takes a single argument and returns the number of distinct values within the aggregate group.
STDDEV_POP()return the population standard deviation.
STDDEV_SAMP()return the sample standard deviation.

These functions are specifically for use with View fields. These functions return a single value for each distinct group of messages, as identified by distinct combinations of values in the Grouping clause. This class of functions existed in previous versions of AMPS with functions such as AVG(), COUNT(), MIN(), MAX(), and SUM(). The addition of these new aggregation functions allow you to perform more advanced statistical analysis on your data right inside AMPS, allowing you to get the analysis you need with lower latency and less complexity.

Conclusion

The AMPS expression language was always very powerful. It’s one of the key pillars of the flexibility of AMPS. These new functions have expanded that flexibility, giving you even more options to tailer AMPS perfectly to your use case.

AMPS 5.2 has brought a huge amount of new features; too much for a single blog post! look for the rest of this series of blog posts as we begin to highlight more new AMPS 5.2 features. AMPS Speed!

Is Your App Solid? (Does it need SSD?)

$
0
0

man on tricycle with rocket strapped to his backIt’s 2017 and this is the year Gartner estimated more revenue will come from selling Solid State Drives (SSDs) than their slower, spinning, ancestral Hard Disk Drives (HDDs). 1 To some, this seems like a no-brainer, but many experts believe the estimate is way off as HDDs continue to improve capacity, MTBF (Mean Time Between Failure), performance, and price. As more enterprises adopt SSDs, there have been shortages in flash memory used in their construction, which has driven prices up and created supply chain delays. That’s why we’re here, to explore situations where you really need SSDs vs when something else may be good enough (or better!) for your use.

Let’s quickly review the primary differences that make up the choice: Capacity, Failure rate, Performance (both sequential and random I/O), Price and Sourcing. This is a high-level comparison only, data-center architects are often considering many more factors such as heat, power, form factor, compatibility, vendor preference, and ease of installation.

  • Capacity: HDD is currently the winner here. You can easily buy +10TB drives today and it’s estimated we could see 100TB drives by 2020. If you’re goal is to cram as much storage as you can into the smallest space possible, then the density of HDDs is a winner.

  • Failure Rate: Both SSDs and HDDs are making amazing improvements in reliability, with some SSDs and HDDs reporting MTBFs of >1.5M hours, we consider these equivalent. This means if you operate 167 drives for a year, you’ll expect to see an average of 1 fail.

  • Performance: Both SSDs and HDDs are great at sequential I/O throughput. SSDs are a clear winner over HDDs on random I/O and have service times that are measured in microseconds, not in milliseconds where moving parts must seek to the I/O location on each operation. If you’re primarily doing sequential I/O (like recording video or time series data), then HDDs could serve you well. However, if you’re requiring the fastest service times and optimal performance for random I/O, then you need SSDs. It’s important to understand your workload and isolate your HDDs for sequential I/O workloads, otherwise other tasks that will move the device’s write head and you’ll see performance degrade to that of the random I/O workloads.

  • Price: Price is a tricky subject – are you wanting to optimize spend over space or time? That is, do you measure “capacity” in terms of gigabytes or in transactions per second? If you’re looking at transactions per second per dollar, then you may need SSDs. However, most comparisons use $/GB metrics and with HDDs giving between 8-10x more capacity per dollar spent, I’d consider HDDs here the winner in most cases.

  • Sourcing: We’ve already seen flash shortages that disrupt the availability of SSDs making it difficult to make large purchases at times – meaning higher costs and longer lead times to get them when you need them. There are many reasons for flash shortages (material shortages, demand, etc.) and it’s difficult to predict when they’ll happen. If you’re needing SSDs, make sure you plan your sourcing process far ahead to get the devices you need when you need them! HDDs are currently easier to source, so in some urgent storage scenarios, you may not even have a choice of going with SSDs.

HDD compared to SSDHDD vs SSD on Common Attributes

What’s This Mean for Customers of AMPS?

AMPS can benefit from fast storage on several dimensions. The most obvious one is transactional volume in its transaction log. Since AMPS writes to the transaction log durably (it doesn’t acknowledge it’s stored until the device has completed the write) then the throughput of the device dictates the transaction throughput of the system. For this comparison, we’re using commodity devices locally attached to AWS cloud instances and the device was completely isolated, so this was the best-case scenario for sequential write performance for these devices. (Important: Using higher-end, enterprise SSDs AMPS can do easily 5x these numbers.)

Peak througputPeak throughput comparison

You can see that an HDD does well at 300K messages per second. There are many messaging problems where that’s easily enough capacity – however, you need to be careful to isolate the AMPS transaction log to prevent other applications or services from moving that write head. If you’re over 100-300K messages a second, you’ll want to look at an SSD. If you require more than 300K/s, you may want to start considering higher end SSD devices as well where you can achieve 2-3 million transactions per second.

If you have a transactional State-of-the-World (SOW) topic, then you’ll have a workload that’s considered random I/O and the performance of your AMPS deployments can greatly benefit from SSDs. When AMPS updates records for transactional SOW topics it will typically update the on-disk record image in-place, which has all the characteristics of random I/O for most workloads and abysmal HDD performance. This also means that instance recovery or SOW topic rebuilds can be done much faster on SSDs.

Transactional SOW performance

Transactional SOW performance

Event Stream Replay Performance

AMPS has a sophisticated transaction log replay system that allows users to replay content filtered event streams at a specific rate – for example, you could replay an event stream at 4x the real-time rate, 5MB/s, or 50,000 messages per second. Some users have 1000’s of these replay consumers at any given time, which can put tremendous stress on the storage device in environments where the total persisted event stream is much larger than the amount of memory available in the host environment.

The AMPS Transaction log is composed of individual journal files, where the latest journal file is being written to and any of the journal files could be concurrently read from. These event stream replay consumers, even though they’re individually sequential, will perform like a randomized I/O workload in aggregate. Because of the randomized I/O pattern, the write performance to the head journal will suffer in HDD environments with several concurrent replay consumers.

In the following diagram, you can see a high-level view of the AMPS transaction log, showing replay consumers reading from “cold” journals as well as the head journal being written to. We’ve designed AMPS so that cold journals can be archived to cheap-n-deep HDD (or even NAS) so that certain deployments only need SSD storage to cover their “hot” data where the data is being read and written to.

Transaction log flowTransaction log overview

Warnings & Tips

Slow SSDs: Don’t go buying SSDs assuming any SSD will be better than any HDD, there do exist SSD devices that are far slower/worse than HDDs – check the drive specs before buying!

File System: The choice of file system can make a huge difference in performance for some work-loads, but more importantly are the mount options for the device. For example, if you’re using the popular ext4 file system, do you need to have journaling or can you turn it off for a performance benefit? Can you use noatime and nodiratime to turn off file metadata updates to update the access time for every read?

Multi-Tenant Environments: If you plan on running multiple AMPS instances on the same host or other applications alongside an AMPS instance, you’ll want to be careful to isolate the load or provide enough capacity to achieve your objectives. It’s a common error to benchmark systems independently and then deploy collectively not aware of how the resources degrade non-linearly under load.

So, Do I need an SSD or not?

TLDR; Here are some questions to help determine if you truly need an SSD for your AMPS deployment. If you answer “Yes” to any of these, then you’re a great candidate for an SSD and it’s unlikely you’ll regret paying up for the SSD device.

Will you be operating multiple I/O heavy applications on the host?

Multi-tenant environments where performance matters can benefit from SSD and minimize the disruption of one service from I/O bursts of another.

Will you be storing more than 2x the hosts available memory on the device?

When the amount in storage vastly exceeds the host’s memory, system performance can be lost to OS virtual memory paging activity.

Do you plan on making heavy use of bookmark/replay subscriptions?

Or

Do you plan on using transaction log backed SOW topics?

These features can approximate a randomized I/O workload and can benefit from SSD devices.

Will you be publishing bursts of events or messages at more than 100MB/s?

If you’re publishing message bursts at greater than 100MB/s and you’re latency sensitive, then you’ll need an SSD. If you’re publishing bursts of more than 200MB/s, you may want to look into a higher end SSD/flash device.

Can you afford the monetary costs and sourcing lead-time?

SSDs are currently more expensive and the sourcing lead-time can be significant for some firms. If you need ample storage today, you may not have SSD as an option.

Summary

Because of the differences in performance, cost, and availability, both HDD and SSD options continue to thrive. Every quarter the HDD vendors offer more capacity and a lower price while SSD vendors are cranking up capacity and performance. If you’re even asking the question “Do I need an SSD?” and you can buy an SSD device that matches your criteria for performance, capacity, budget, and time-to-market, then you should’ve already done it.

Beat the Traffic With Conflation

$
0
0

congested freeway
Does your network bandwidth ever feel like this congested freeway? Do you ever have a subscription that gets so many messages that it really cannot process them all? If you answered yes, why haven’t you tried using conflated subscriptions?

Conflated subscriptions help to reduce the bandwidth for a subscription and may reduce the processing resources required for that subscription as well. They work just like conflated topics, which are defined in the AMPS config, but with a couple of differences. The differences are you can set the conflation interval on a per subscription basis and you can subscribe to any topic, not just conflated topics. This is great if you have multiple subscriptions that may have different intervals in which they need to process data.

Let’s look at an example where conflated subscriptions might be useful. Imagine there is an application which displays selected stocks with their current prices. This display refreshes every two seconds. Since the application only refreshes the display every two seconds, it only needs new data every two seconds, rather than a full stream of the price changes. On the other hand, a trading desk might need the full stream of messages and therefore will not set a conflation interval or conflation key(s) on their subscriptions.

To accomplish this, the display application can place a subscription that updates the price based on the tickerId with a conflation interval of two seconds and a conflation key of tickerId.

For example, in Python:

client=AMPS.Client("myConflatedClient")client.connect(uri_to_amps)client.logon()command=AMPS.Command("subscribe").set_topic('prices') \
              .set_options('conflation=2s, conflation_key = [/tickerId]')message_handler=messageHandler()client.execute_async(command,message_handler)

AMPS will hold the data for each distinct tickerId for two seconds before sending a message to the application. For example, AMPS will receive the following messages within the conflation interval:

{"tickerId":"IBM","price":150.34}{"tickerId":"IBM","price":149.76}{"tickerId":"MSFT","price":70.76}{"tickerId":"IBM","price":149.32}{"tickerId":"MSFT","price":70.94}{"tickerId":"IBM","price":151.10}

Any messages that are received by AMPS with the same tickerId will be replaced until the two second interval is reached and then the data is sent to the subscriber. Only the last message for each conflation_key is delivered by AMPS at the end of the interval:

{"tickerId":"IBM","price":151.10}{"tickerId":"MSFT","price":70.94}

This means the application does not have to process many updates that will ultimately never end up being displayed, it will not waste time parsing unecessary updates and an up to date price is always shown on the refresh interval. This will free up some of your bandwidth and let you unleash the horses under the hood of your other subscribers. This also means that your application may not receive messages strictly in the order published, but will receive the last message for each distinct conflation key during the interval. fast car on luminous highway

Even More Power

Conflated subscriptions are new in AMPS 5.2. They’re just one of the ways that AMPS can provide conflation. Conflated subscriptions are the simplest to demonstrate, since they don’t require changes to the AMPS configuration. Conflated subscriptions require AMPS to calculate conflation individually for each subscription that requests conflation. If several applications (or several instances of an application) all need conflation at the same interval, use a Conflated Topic instead. The results are the same for each individual subscriber, but AMPS keeps track of conflation for the topic as a whole rather than an individual subscription, which is more efficient. Conflated topics are also available in older versions of AMPS, so if you’re on an earlier version, conflated topics are the available option.

Do-It-Yourself SOW Keys

$
0
0

key cutting machineThe AMPS State-of-the-World (SOW) depends on being able to identify distinct updates to a message. AMPS does this by creating a SOW key for each message: subsequent updates that have the same key are updates to the same message. In many cases, it’s convenient to have AMPS determine the SOW key for a message based on the contents of the message.

That’s not the only way to get a SOW key, though. An explicit SOW key allows a publisher to specify the SOW key of a message at the time the message is published. AMPS does not try to interpret the data within the message to generate a SOW key, or to determine if the message is unique. Instead, AMPS relies only on the provided SOW key to determine the identity and uniqueness of the message. This can be useful for a variety of different purposes.

Common Uses

There are two common uses for explicitly defining your own SOW keys that I would like to mention.

The first common use is for binary message types. Explicit SOW keys are necessary for binary messages because AMPS will not attempt to parse a binary message, and therefore cannot obtain a SOW key from within the message. With that in mind, explicit SOW keys are the only way to build a SOW topic that contains binary messages.

The second common use of explicit SOW keys is situations where a message does not contain a unique key, and you aren’t able to add one to the message itself. In this situation, you would give AMPS a different key for each unique message published.

Though these may not be the only situation that an explicit SOW key could be used, they are the most common.

Considerations When Generating SOW Keys

There are a few things to keep in mind when generating your SOW keys:

  1. All publishers should use a consistent method for generating SOW keys. This is to guarantee that all publishers can update the proper message in the SOW.
  2. SOW keys must contain only characters that are valid in Base64 encoding.
  3. The application must ensure that messages intended to be logically different do not have the same SOW key.

As long as you are able to meet this criteria, your keys can be anything that you want.

Configuring AMPS

Configuring AMPS to use explicit SOW keys is quite similar to configuring any other topic in the SOW, with one important difference. The Key option will not be provided. Here is an example a SOW configured to use explicit keys:

<SOW><TopicDefinition><Topic>Foo</Topic><FileName>path/to/sow/Foo.sow</FileName><MessageType>json</MessageType></TopicDefinition></SOW>

If you provide a Key in the configuration, any explicit SOW key set on a publish message will be ignored and the configured Key will be applied.

Publishing the SOW Key

Explicit SOW keys are set on a publish message using the Command Interface. This is done by creating a publish Command object, then calling set_sow_key on that object. A python example of this would be as follows.

# Let's build a simple publish Commandcmd=AMPS.Command("publish").set_topic(topic).set_data(data)# Now let's set the SOW keycmd.set_sow_key(key)# and finally send it, using# execute_async with no handler# for efficiencyclient.execute_async(cmd,None)

That’s all there is to it! Once the message is published, AMPS will handle the rest.

SOW Queries

Data published with an explicit SOW key can be queried with a content filter just like any other non-explicit SOW topic. You can also query this data using the SOW key that you provided. In order to issue a query by the explicit SOW key, you build a SOW Command and set the SOW key on that Command. Here is an example of this:

cmd=AMPS.Command("sow")cmd.set_sow_key(key).set_topic(topic)forminclient1.execute(cmd):print"%s: %s"%(m.get_sow_key(),m.get_data())

Though this might not be useful in every case, the query will be faster for those applications that need it. If your application only needs to store and retrieve values using a single key, using an explicit SOW key is the most efficient approach.

Further Reading

For more details, see How Does the State of the World Work? and the section on SOW Keys in the AMPS User Guide.

Closing Thoughts

Using an explicit SOW key can be useful when you have no way of identifying a key within the message itself. This is particularly the case with Binary messages, but it may have many other uses. As long as your application has a way of consistently generating a unique SOW key for each unique message, then setting an explicit SOW key might be for you!

Pirates of AMPS: Dead Man's Queue

$
0
0

burning letter with skull and cross-bones

Queues are the bread and butter of a good messaging system. AMPS provides a powerful queue system that is fast, resilient, and flexible, taking work from publishers and feeding them to consumers as fast as your network will allow.

The real world, unfortunately, has time constraints. AMPS Queues are extremely performant and are often used in very time sensitive use cases such as the processing of market data. It is extremely important that consumers of these time sensitive queues don’t receive stale data or poisoned data that can cause the system to get stuck. I will talk about what I mean by poisoned data later, but lets take the basic case of stale data first. AMPS solves this problem by allowing an expiration to be set on queue messages.

If a message outlives its expiration it is forced to walk the plank and is removed before another client can receive it. This is great! It assures that consumers only have the latest messages, and everything is smooth sailing on the AMPS seas.

Normal Queue and Dead Letter Flow

While keeping only the latest messages in the queue is important for time sensitive applications, those stale messages can still be useful! Statistics on those stale messages can contain important clues about possible problems and improvements to consumer clients. In use cases where consumer speed is of the upmost importance, these statistics are a map to hidden treasure for your business. If only there was a way to save those expired messages…

The Dead Letter Queue

A secondary queue that tracks expired messages from one or more primary work queues is known as a dead letter queue. The powerful automated actions platform of AMPS allows you to not only build a dead letter queue, but using AMPS views, you can create conflated statistics of your dead letter queue. You can use this queue and view setup to gain unpreceded insight into your AMPS queue performance!

This whole system hinges on the on-sow-expire-message action. This powerful action acts like a life boat for those stale messages walking the plank.

You might be saying to yourself, “on-sow-expire-message? But I thought we were talking about queues not sows?” Yes! But this is part of the power of the AMPS platform. Queues are implemented as a view over an underlying topic or set of topics that are backed by a transaction log. Among other things, this allows AMPS actions to receive events from Queues just like they were a SOW. It requires no extra effort on your part to get this functionality.

The AMPS Actions Platform

Just a quick aside. The AMPS actions platform is extremely flexible and modular. This dead letter queue is just one particular (rather simple) example of an AMPS action design pattern. The full functionality of AMPS actions is available for you to use with the expired messages. You even have full access to the message data through amps-action-do-extract-values. You could trigger a log rotation, a SOW compaction, write to a log, turn on your smart toaster, etc… See the AMPS User Guide chapter on Actions for all the gory details.

AMPS Views: the secret to unlocking the treasures of the Dead Letter Queue

Other platforms offer dead letter queues. It is a common design pattern. The innovative differentiator of our queue is that it can show more than just queue depth. The AMPS dead letter queue is a full fledged queue, with complete access to its data. You can perform arbitrary queries and views over the data in the queue.

Here is an example of the simple case: a view that shows the queue depth, last received stale message, and the time that message was received.

<View><Name>DeadLetterStats</Name><UnderlyingTopic>DeadLetters</UnderlyingTopic><MessageType>json</MessageType><Projection><Field>COUNT(/data/id) AS /totalDeadLetters</Field><Field>/data/id AS /lastProcessedId</Field><Field>/received AS /lastReceived</Field></Projection><Grouping><Field>/totalDeadLetters</Field></Grouping></View>

Let’s see how we can spice it up! We have full access to the message data, so how about using GROUPBY to nicely group our dead messages:

<View><Name>DeadLetterStatsByRegion</Name><UnderlyingTopic>DeadLetters</UnderlyingTopic><MessageType>json</MessageType><Projection><Field>/data/region AS /region</Field><Field>SUM(/data/rumPrice * /data/rumQty) AS /totalLostRumCost</Field></Projection><Grouping><Field>/data/region</Field></Grouping></View>

With this aggregated the view, the Royal Navy could very easily see the total value of Rum lost, grouped by each region.

Use-Case Ideas

Any kind of SQL style query you can think of can be performed over your dead letter queue. Here are some possible examples to get your gears turning:

  • Your queue receives messages from different regions. GROUPBY the region identifier to determine which region is losing the most messages from the queue.

  • In a market order system, you can aggregate the monetary value of all the dead order messages with SUM to give an aggregated value for the lost messages. (This can be used as a powerful incentive metric for your team)

  • If SUM is too simplistic, you can get the average value of /order_price * /quantity over all the orders in the dead letter queue.

  • If you use variable length messages in your system, you can compute the AVG and STDDEV_POP over the byte size of the dead messages to get an idea of the variance of the size of the problem messages.

A little bit of self promotion: check out my earlier blog post on AMPS actions for an in depth discussion of the kinds of processing you can do over the data in your dead letter queue.

Poison! a.k.a Forced Expiration in AMPS Queues

A good pirate always checks their rum!

While stale messages are an important consideration for queues, there are other cases that can necessitate the forced expiration of a message from a queue. This could be the extreme case of a message with corrupted data, or simply a message containing a request that could not be fulfilled by a consumer, such as being unable to commit the message to an external database for some reason. We refer to these as poisoned messages, and as of AMPS 5.2.1.0, we have set of features that allow you to safely handle them, making your AMPS queue’s even more robust!

Poisoned Letter Disrupting a Queue

Forced Expiration Features

Let’s break down the new features added to AMPS queues and explain why you will love them. First, there are two new options that have been added to the AMPS queue configuration:

How they add safety to your queues? - MaxDeliveries: an upper bound to the number of times AMPS may deliver a queue message before automatically expiring it.

  • MaxCancels: a limit to the number of times a subscriber may cancel a lease on a message before it is expired.

At first it might seem like these two limits are redundant, but they work in conjunction. MaxDeliveries is checked when a message is submitted to a consumer from AMPS. MaxCancels is checked when a message is returned to the queue.

This gives you the maximum flexibility to determine the behavior that best fits your use-case. For some use-cases it’s more important to check canceled messages before they hit the queue again, and for other use cases it may be fine that they re-enter the queue, but they should only be allow so many delivery attempts.

You can define both MaxDeliveries and MaxCancels on the same queue. Note: Delivery is counted each time a message is delivered, so a message that is delivered and then cancelled counts both a delivery and a cancellation. In this case, a message is initially sent out, which counts as a delivery. When the message is then canceled, it will increment its cancel count right before it hits the queue again. MaxDeliveries is checked when a message leaves, MaxCancels is checked when a message returns.

See the AMPS User Guide for more details about MaxDeliveries and MaxCancels

These new Queue limits are extremely valuable to keeping your queues operating safely and at peak performance, but that’s just one part of the solution! If things do go wrong and we get slow queues or poisoned messages, we need as much data as we can get to solve the problem!

We got you covered on that end too! The on-sow-expire-message action has been supercharged with a new context variable:

  • AMPS_REASON: A comma-delimited string indicating one or more reason(s) the message was expired. Here are the values that AMPS_REASON can contain:

  • time_limit: This is the standard Queue timeout condition.

  • max_cancels: The message exceeded the maxCancels limit.

  • max_deliveries: The message exceeded the maxDeliveries limit.

  • forced_expire: A consumer forced the message to expire from the queue immediately.

AMPS_REASON gives a detailed picture of why messages are being expired from your queue. And remember, you can use the full power of AMPS views and aggregation with AMPS_REASON inside your dead letter queue. Not only can you see which messages are dying, you can now see why they are dying, and calculate a full range of queries and statistics over that data!

forced_expire is particularly powerful because it gives you a feedback mechanism between your consumers and AMPS. If a consumer detects some kind of problem with a message, it can force_expire the message, giving you a discrete flag that you can immediately take action on. For a more in depth discussion of handling poisoned messages in your consumer code, check out this excellent blog from my colleague Dirk.

A message that hit max_cancels could just be the result of a down-stream network slowdown, but a message with force_expire was a client very explicitly telling you that it could not process that message. This kind of granularity brings a whole new level of power to your monitoring infrastructure, allowing you to respond to problems faster and keep your queues running longer.

Let’s view some sample snippets from a config that implements this:

1) The main queue definition:

<Queue><Name>WorkToDo</Name><MessageType>json</MessageType><Semantics>at-least-once</Semantics><UnderlyingTopic>Work</UnderlyingTopic><Expiration>60s</Expiration><MaxDeliveries>2</MaxDeliveries><MaxCancels>2</MaxCancels></Queue>

2) Let’s make a DeadLetters queue to store these poor dead messages:

<Queue><Name>DeadLetters</Name><MessageType>json</MessageType><Semantics>at-least-once</Semantics></Queue>

3) A view over the DeadLetters to give you those awesome metrics:

<View><Name>DeadLettersByReason</Name><UnderlyingTopic>DeadLetters</UnderlyingTopic><MessageType>json</MessageType><Projection><Field>/reason AS /reason</Field><Field>COUNT(/data/id) AS /numMessages</Field><Field>/received AS /lastReceived</Field></Projection><Grouping><Field>/reason</Field></Grouping></View>

4) The action definitions to tie it all together:

<Actions><Action><On><Module>amps-action-on-sow-expire-message</Module><Options><Topic>WorkToDo</Topic><MessageType>json</MessageType></Options></On><Do><Module>amps-action-do-publish-message</Module><Options><Topic>DeadLetters</Topic><MessageType>json</MessageType><Data>{ "data" : , "received" : "", "reason" : "" }</Data></Options></Do></Action></Actions>

See the AMPS User Guide for more details about AMPS_REASON

Queue Semantics

As another important aside, AMPS queues provide two different modes of delivery semantics. These two modes act very differently, and it’s important to understand how queue performance and message expiration is affected by these modes:

  • at-least-once semantics
    • Messages are leased to a consumer, which must acknowledge the message or the message will be automatically returned to the queue.
    • It is equivalent to a don-destructive get from a traditional queue.

at-least-once semantics are most susceptible to poisoned messages, because the bad messages can be automatically returned to the queue, continuing to cause processing bottlenecks. This semantic mode is why the forced expiration features described above were created. The advantage of at-least-once mode is reliability, and the force expiration AMPS_REASON feature allows more detailed analysis of why messages are failing.

  • at-most-once semantics
    • The simplest way to remember these semantics is: “fire and forget”. Messages that are sent to a consumer are immediately removed from the queue and are never returned.
    • It is equivalent to a destructive get from a traditional queue.

at-most-once semantics favors performance over reliability, and thus does not attempt to make any guarantees about whether a message was successfully processed once it has been sent. This makes it less susceptible to poisoned messages, but it also gives you less insight into why messages may have failed to be consumed properly.

In fact, this mode does not support the MaxDeliveries or MaxCancels options. at-most-onceonly supports timeout expiration. This makes intuitive sense since a message in an at-most-once queue will only ever be delivered once, and can never be canceled by a consumer.

The on-sow-expire-message action still works with at-most-once queues, and dead letter queues work the same way.

The important note is that there is only one condition in which a message will be sent to the dead letter queue: the message timed out.

Note: There are many more subtle differences in behavior between these two modes of operation. See the manual for more details

Sample Dead Letter Queue Config

Finally, here is a complete working sample configuration for a Dead Letter Queue implementation in AMPS 5.2.1.0:

<AMPSConfig><!-- Name of the AMPS instance --><Name>dead-letter-queue-server</Name><ProcessName>ampServer</ProcessName><ConfigIncludeCommentDefault>enabled</ConfigIncludeCommentDefault><SOWStatsInterval>1s</SOWStatsInterval><Admin><FileName>./dead-letter-queue/stats.db</FileName><InetAddr>localhost:8085</InetAddr><Interval>10s</Interval><SQLTransport>websocket-any</SQLTransport></Admin><MessageTypes><MessageType><Name>json</Name><Module>json</Module><AMPSVersionCompliance>5</AMPSVersionCompliance></MessageType></MessageTypes><Transports><Transport><Name>nvfix-tcp</Name><Type>tcp</Type><InetAddr>19090</InetAddr><MessageType>json</MessageType><Protocol>amps</Protocol></Transport><Transport><Name>websocket-any</Name><Protocol>websocket</Protocol><Type>tcp</Type><InetAddr>9008</InetAddr></Transport></Transports><Logging><Target><Protocol>file</Protocol><Level>trace</Level><FileName>./dead-letter-queue/server.log</FileName></Target></Logging><TransactionLog><JournalDirectory>./dead-letter-queue/journals</JournalDirectory><Topic><Name>Work</Name><MessageType>json</MessageType></Topic><Topic><Name>DeadLetters</Name><MessageType>json</MessageType></Topic></TransactionLog><SOW><Topic><Name>Work</Name><MessageType>json</MessageType><FileName>./dead-letter-queue/work.sow</FileName><Key>/id</Key></Topic><Queue><Name>WorkToDo</Name><MessageType>json</MessageType><Semantics>at-least-once</Semantics><UnderlyingTopic>Work</UnderlyingTopic><Expiration>60s</Expiration><MaxDeliveries>2</MaxDeliveries><MaxCancels>2</MaxCancels></Queue><Queue><Name>DeadLetters</Name><MessageType>json</MessageType><Semantics>at-least-once</Semantics></Queue><View><Name>DeadLetterStats</Name><UnderlyingTopic>DeadLetters</UnderlyingTopic><MessageType>json</MessageType><Projection><Field>COUNT(/data/id) AS /totalDeadLetters</Field><Field>/data/id AS /lastProcessedId</Field><Field>/received AS /lastReceived</Field><Field>/reasion AS /lastReason</Field></Projection><Grouping><Field>/totalDeadLetters</Field></Grouping></View><View><Name>DeadLettersByReason</Name><UnderlyingTopic>DeadLetters</UnderlyingTopic><MessageType>json</MessageType><Projection><Field>/reason AS /reason</Field><Field>COUNT(/data/id) AS /numMessages</Field><Field>/received AS /lastReceived</Field></Projection><Grouping><Field>/reason</Field></Grouping></View></SOW><Actions><Action><On><Module>amps-action-on-sow-expire-message</Module><Options><Topic>WorkToDo</Topic><MessageType>json</MessageType></Options></On><Do><Module>amps-action-do-publish-message</Module><Options><Topic>DeadLetters</Topic><MessageType>json</MessageType><Data>{ "data" : , "received" : "", "reason" : "" }</Data></Options></Do></Action></Actions></AMPSConfig>

How will you use this new features of AMPS to sail the seas and find the treasure? Submit your use case for this capability here or via email and we may send you a cool t-shirt!


The Canary Sings! AMPS and ITRS Geneos 4.0

$
0
0

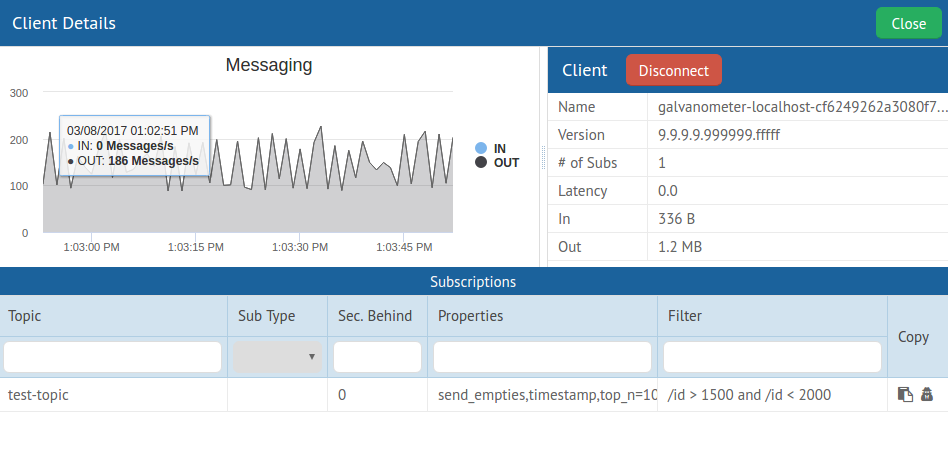
Simple, effective alerting can be yours with AMPS and ITRS Genos 4.0Alert ! We released a sample AMPS plug-in for ITRS Geneos 4.0 that can be used to build real time reporting and alerting based on customizable rules and thresholds. Many of our customers are already using ITRS Geneos to consume the rich monitoring information from multiple AMPS servers and other systems to provide a real time system-wide view of health metrics. We noted that many customers seemed to be writing their integration piece in their own way so we worked with ITRS to create a generic plug-in that can be used to capture the AMPS metrics by Geneos.   After working with ITRS on Geneos 4.0 support, we are pleased to announced that the AMPS-Geneos plug in is available at this public Github repo . 
Brand Hunt, co-founder and President of 60East Technologies, explains: ”inside of our AMPS product, we give visibility into every component. With a product that does millions of transactions per second, 10’s of thousands of connected client sessions, and global deployment across 1000’s of servers, great monitoring is critical to the health of our customers’ business. ITRS makes it easy to consume, monitor, and propagate alerts across a large number of metrics and servers, which is why it’s our first recommendation for our largest enterprise customers. In fact, ITRS is the only monitoring system we’ve found that can take advantage of the full range of metrics exposed by our AMPS product and deliver the operational flexibility required by our most demanding enterprise customers.” - ITRS Blog

AMPS Monitoring

Whether you use ITRS Geneos, DataDog or other system -   we supply a wide range of ‘canaries’ or proxy metrics that are critical to preventing and detecting faults impeding service level agreements.   This blog will explore some of the best practices and means to monitoring AMPS including monitoring, logs, actions and internal events.     Let’s take a step back and provide an overview of how AMPS provides this information and how you can take advantage of it. 

Real Time System and Instance Monitoring

blog Galvanometer

AMPS provides several ways of exposing monitoring metrics.   The most prominent tool is our Galvanometer which provides a GUI for host, system and deployment statistics as well as a query facility to inspect AMPS business content.  Just having a simple view of what clients are connected, and when the server restarted has been a great boon to operational insight. The roadmap for this tool is just full of practical capabilities but we are indeed looking for feedback on how it can help make your days more sane. 

For more browser based or programmatic (API) based use cases - customers also leverage our entitlement-based browsable Admin Console  to get a similar set of metrics as provided by the Galvanometer. This is where one can browse our monitor rich statistics such as rates, connection counts and replication performance.  It also enables one to perform changes to the system such as disconnecting clients. One can also use the programmatic RESTful interface to the console to capture information from external systems. 

For example, one could monitor replication statistics in this manner :

watch -n 2"wget -qO- localhost:8087/amps/instance/replication/DR_instance/seconds_behind"

Historical Data

The historical information in Galvanometer and the Admin Console comes from our optional stats.db database which allows you to run queries that compare the stats over time. Given that we store system, instance and client level information,  it is a common use case to try to correlate what type of load the system was handling when a flood of a thousand connections arrived.  The interval of sampling can be configured to mitigate database bloat or to facilitate fine-grained detective work.

In a typical operational use case, one can poll the Admin Console to produce ad-hoc alerts (and even publish back alerts to AMPS) and run end-of-day or week reports based on the statsdb content (before purging it etc).

For example, from the StatsDB, to view which clients have fallen behind at one time, one can run:

sqlite>SELECTs.client_name,MAX(d.queue_max_latency),MAX(queued_bytes_out)FROMICLIENTS_DYNAMICdJOINICLIENTS_STATICsON(s.static_id=d.static_id)GROUPBYs.client_name;

Also, for simple external or even spreadsheet reporting, one can use the Admin Console interface to have the results of specified monitoring range sent to a csv (or text, XML, RNC etc)  which can easily be turned into excel graphs/plots:

http://localhost:8085/amps/instance/processors/all/messages_received_per_sec.csv? t0=20111129T0&t1=20111129T232500

Real Time Internal Event: Tracking whom is doing what

The AMPS engine publishes metrics to internal Event Topics that provide particularly useful information about client connections and the state of topics in the SOW.

The AMPS engine will publish client status events to the internal /AMPS/ClientStatus topic whenever a client issues a logon command, disconnects, fails authentication, enters or removes a subscription, queries a SOW, or issues a sow_delete. This mechanism allows any client to monitor what other clients are doing and is especially useful for publishers to determine when clients subscribe to a topic of interest. AMPS User Guide: Event Topics

Please note that these Event Topics can be configured to be persisted so you can then access the values over a time range.  

Devop Tookit: Actions and Logs

AMPS simplifies operations by providing a set of Administrative Actions which can be defined in configuration.   With these powerful mechanisms, one can schedule automatic responses to either time, content or resource threshold based triggers.   For example, one can invoke a user script if the free storage is under 15% or set up weekly archiving or deletion of log files or even trim the database for content that is a week old.  Read more about Administrative Actions in the AMPS User Guide.

While some tail logs looking for specific messages or error levels, others leverage logging facilities such as Splunk or a Apache Flume based sink such as a Fluentd stack that ties into an HADOOP store or elastic search facility. See more about our AMPS Flume integration .   Often the goal of the system is to be able to leverage the historical logs to deem what is normal and then employ machine learning to alert based on what is unusual (i.e. increased # of client connections or 3X times memory usage).   Such systems are also used to ensure the appropriate maintaining of audit trails for regulatory purposes.   

Business Application Monitoring: Content Limit Checking and Queue Insights

At the application level, most customers either publish information to their own monitoring topic which can be consumed by AMPS clients or stored in the SOW. Others leverage our Views on application metrics to calculate aggregations or counts as well as to implement alerts or limit checks.  For example, one can easily set up complex event processing queries to capture limit checking whenever a single order has a quantity over a million or if quantity*price  > million or if the aggregated count of orders thus for that listing has reached a million $.   The view or aggregation can also be formed on a queue so that on can monitor or alert on the queue’s actual contents rather than just queue depth.  For example, one can provide a view over a dead letter queue to see the nature of the aggregates of source and value of the trades/orders that didn’t get processed. See the Dead Letter Queue Blog  .  This feature is growing in popularity due to both the business and operational value of having insight into a queue’s content.   

Enter ITRS Geneos

While AMPS comes with significant and well-proven monitoring capabilities, one would use Geneos to establish a sophisticated system wide alerting and reporting platform. We have implemented a number of rules that have been recommended to customers for some time. These rules not only note system performance but also to identify when the system is not performing up to expectations.  Note that these aren’t necessarily Geneos specific.

Here are some examples of rules that we recommend .

  • All Processors Last Active  > 20000 This detects if the message processor (i.e. the AMPS engine) has not been used which could be indicative of no input or ingestion related issue or other resource constraint.

  • file_system_free_percent <10 This is the key to trigger an alert when the file system is down to 10% of its capacity.   AMPS also has a “do” Action to provide triggered behavior based on this threshold.

  • Clients queue_max_latency > 10 This will help ascertain if there is an issue due to slow consumer behavior where AMPS is detecting TCP push back while trying to send data.  

  • Replication seconds_behind > 30 During replay for recovery or back testing, this indicator highlights when there is a constraint impacting the recovery steam.   

  • Views queue_depth >20000 The number of messages in the view that have not yet completed processing which can be indicative of a resource limitations (complex view processing can be CPU intensive).

These rules were chosen due to their prevalent use in customer environments. There are many many more rules that could be configured however their relevance depends on whether they need stats re: views, replications, the State of the World (SOW) database etc.

For More Information:

The Monitoring Reference guide lists all the aspects being monitored which can be accessed via the HTTP port.  We also encourage people to use a browser to get familiar with its structure and content.

The Statistics Database Reference describes the table structure of the same statistics that you can run queries against. This also has to be enabled in the configuration file and an interval for sampling can be provided.

Alerting 60East ! 

We would love to hear from you about your monitoring needs.  We know that you have built and ran large systems and have faced hardware and software failures and have proceeded to build up preventative practices.    Please share them with us - we would like to continually improve AMPS monitoring and operational capabilities.

Thank you!

Grids Without Gridlock: Which is Fastest?

$
0
0

Learning to love the gridThere are lots of reasons to choose a web interface over a native graphical interface. Web interfaces are universal, work on most devices and platforms, have very flexible and feature-rich design capabilities, and do not require any installation for users. That being said, performance is still a big concern. It is especially challenging if the data source for that application is AMPS itself – the world’s most impressive messaging system that can easily overwhelm the fastest applications. Which web grid components have enough capacity to handle millions of elements and hundreds or even thousands of updates per second?
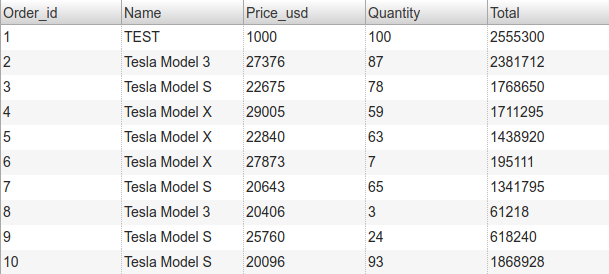
We’re about to find out!

Why and What

Our AMPS product is commonly used as a View Server for high-performance financial market systems. Our customers are often looking to us for advise on which components can best meet their needs.

In these View Server use-cases, data received from AMPS is often displayed in some form of a grid. This is not static data though – the contents of the grid can change in real time, as AMPS delivers updates and new data. This article is a comparison to measure which web grids can provide a feature-rich, responsive, and memory-efficient solution to this use-case. Today, we are testing 5 different grids that promise great performance and rich functionality:

  • ag-Grid 13.2.0: “The Best HTML 5 Grid In The World” is claimed to be used by over 15% of the Fortune 500 companies. To make it even more interesting, we will also test its React and Angular4 components, to detect how fast they perform compared to a pure JavaScript solution.

ag-Grid tableag-Grid 13.2.0

  • SlickGrid: a very fast and snappy HTML grid that is designed for maximum performance.

SlickGrid tableSlickGrid

  • OpenFin’s HyperGrid 2.0.2: the unique grid that is using Canvas instead of DOM to render its contents. This feature allows HyperGrid to handle millions of rows of data and thousands of simulataneous updates without slowing down the user interface.

HyperGrid tableHyperGrid 2.0.2

  • Webix DataTable 4.3.0: part of Webix framework, DataTable component provides a highly efficient grid that delivers blazing fast performance.

Webix tableWebix DataTable 4.3.0

  • PrimeNG DataTable 2.0.6: part of the popular Angular-based UI framework, it provides a rich feature set and great customization opportunities. Unfortunately, turned out it was way too slow in our tests, that’s why it was excluded from the final results. Without pagination, the PrimeNG grid can only handle ~5K records without having significant performance issues.

PrimeNG tablePrimeNG DataTable 2.0.6

All the above grids have similar functionality, such as:

  • Tree Tables
  • Filters / Sorting
  • Cell Editors
  • Various selection models
  • Live Updates
  • Styling options
  • Data Binding

Detailed feature descriptions are available on the grids’ websites.

How

Each grid in the above list claims to have incredible performance, but how would we determine who actually is the best? User experience is everything. The grid should look good, feel snappy, fit huge amount of data and yet still go easy on memory as it often is a limited resource. A good grid shows results of a query with subsequent updates that occur to that grid, such as deletes, updates, and new records. An average message size is 140 Bytes– it’s big enough to show meaningful information and is small enough to fit millions of such messages into the grid without taking all the available RAM. The following set of tests should give us a good picture of how the selected grids will perform in a real world situation:

  • Rendering Time: how much time it will take to render the initial portion of data. Fast rendering is important so that the web application loads and is ready to work as soon as possible. Another situation when fast rendering might be useful is switching data sets to display in the grid.

  • Frames Per Second (FPS): The more FPS a grid can produce while being used, the smoother and more responsive it looks and feels. Significant changes in FPS are perceived as freezes and should be avoided as much as possible.

  • Memory Consumption: If a grid is memory efficient, it can work well and do more on a device with a low amount of RAM, such as mobile devices and laptops. In our test we will measure how many rows/records a grid can render using no more than 4 GB of RAM.

  • Live Updates: rendering the initial portion of data is important, but it means nothing if a grid cannot handle changes made to it in real time. According to MDN, “A frame rate of 60fps is the target for smooth performance, giving you a time budget of 16.7ms for all the updates needed in response to some event.” In this test we will measure how many rows per second we can add to the grid while maintaining maximum FPS and experience no lagging. Appending rows to the bottom of the grid is a pretty expensive rendering operation because the grid must update or change its view on every record added.

Environment

Hardware
  • CPU: 6th Generation Intel® Core™ i7-6820HQ Processor (8MB Cache, up to 3.60GHz)
  • GPU: NVIDIA® Quadro® M1000M 4GB
  • RAM: 64GB DDR4 2133 MHz
  • Storage: 1TB PCIe SSD
Software
  • OS: Linux mint 4.10.0-35-generic #39~16.04.1-Ubuntu x86_64 GNU/Linux and Windows 10 Pro 64-bit
  • Browsers:
    • Google Chrome Linux 61.0.3163.100 (64-bit)
    • Mozilla Firefox Linux 56.0 (64-bit)
    • Microsoft Edge 40.15063.0.0 (64-bit)*

Don’t Make Your Customers Wait

Once the initial data portion of a query is loaded (typically, in a separate WebWorker, especially if it’s large), we need to display it in the grid. Considering the size of the initial portion, all grids did great, but as usual, some did better than others.

Grid Comparison: Rendering Time -- 20,000 recordsGrid Comparison: Rendering Time – 20,000 records

Grid Comparison: Rendering Time -- 200,000 recordsGrid Comparison: Rendering Time – 200,000 records

Grid Comparison: Rendering Time -- 2,000,000 recordsGrid Comparison: Rendering Time – 2,000,000 records

Grid Comparison: Rendering Time

The winner is SlickGrid with the mind blowing rendering time that’s independent of the number of records. The Angular4 version of ag-Grid had the best rendering performance among other ag-Grid components, possibly due to the VM-friendly code it produces. Another issue with ag-Grid we faced was its limitation when it comes to the maximum height of the grid container. This lead to the situation when rendering just stopped after 1,342,166 rows. This is not exactly a problem with ag-Grid, just a limitation in browsers which ag-Grid folks mention on their website, however, other grids don’t suffer from it. We solved this by reducing the row height, keeping the total container height below the maximum value.

Smooth Scroll is Important

Okay, we have our data loaded and rendered. Is the grid still responsive and snappy? Can we look through these rows without having a feeling that we’re watching a slide show? To make this test more objective, we were measuring FPS using Chrome Developer Tools. Scrolling using Touchpad/Mouse wheel simulates slow scrolling, while scrolling by dragging scrollbar will show how the grids are optimized for very fast scrolling. As before, we test for each dataset size.

Grid Comparison: Scrolling FPS -- Mouse / Touchpad

Grid Comparison: Scrolling FPS -- Scrollbar

This time, we have no clear winner, rather a group of “cool” kids, which are HyperGrid, Webix, and SlickGrid. ag-Grid Angular4 component had a significant FPS drop compared to its plain JavaScript and React analogues which showed good results otherwise. All grids have different mouse scrolling speeds, thus explaining the average FPS results in each case. HyperGrid truly fullfills its promise of Ultra High Performance and smooth scrolling with no deferred painting for unlimited data sets– it easily handles 2 million rows while maintaining very smooth and consistent experience. SlickGrid completely hides rows if scrolling is faster than some threshold value, thus making it easy to hit maximum results in the scrollbar test. Webix performs great with any dataset, providing the most consistent and smooth experience for both mouse and scrollbar scrolling tests while having no deferred painting. Subjectively speaking, all grids (except Angular4 ag-Grid component) felt very snappy and responsive.

How Much One Can Fit in 4 GB of Memory?

This a pretty straighforward test that answers one simple question – how much data can we display in the grid on an entry level desktop?

Memory Consumption

The winner in this test is Webix, closely followed by HyperGrid which has almost similar memory efficiency. The overhead introduced by React and Angular4 can be observed for ag-Grid; its plain JavaScript solution performed better than its enterprise-oriented counterparts.

It’s Alive!

Now the grid is loaded and rendered all of the original data, but that’s not enough – without real-time updates, the dataset becomes irrelevant. AMPS features, such as sow_and_subscribe command which delivers updates to the initial query set, Content Filtering, Preprocessing and Enrichment, OOF messages, and Conflation provide fine-grained control over updates. These features, combined with our official JavaScript client make real-time grid updates a suprisingly trivial task, of course, if a grid can handle such power.

Live Grid Updates

While ag-Grid has potential and would satisfy a small stream of updates without lagging, the winner, HyperGrid, performed more than 20x better than ag-Grid. It seems like HyperGrid and its Canvas-based rendering engine truly is the future of fast web components, delivering incredible performance close to native interfaces.

Licenses and Pricing

Here we want to provide a quick overview of what licenses are available for each grid and what the prices are for commercial technical support at the time of this writing. Most grids also have free editions as well, although they are not always Open Source compatible.

ag-Grid
Free: MIT Commercial:

  • Single Application: $657/year/dev
  • Multiple Applications: $1,056/year/dev
  • SaaS and OEM available
More information here.
HyperGrid
Free: Community Edition

  • Not Open Source
  • Application must be registered
More information here.
Commercial:

  • Quote-based individual pricing
  • HyperGrid is a part of OpenFin
More information here.
PrimeNG
Free: MIT Commercial:

  • Quote-based individual pricing
  • DataTable is a part of PrimeNG UI Suite
More information here.
SlickGrid
Free: MIT Commercial: Not available
Webix
Free: GPLv3

  • DataTable is a part of Webix Standard
  • 63 Widgets and Controls
  • Compatible with Open Source projects only
Commercial:

  • DataTable is a part of Webix Standard
  • 84 Widgets and Controls
  • Developer Pack (single Dev): $469/year
  • Team Pack: $1,299 /year (5 developers)
  • Enterprise Pack: $3,999/year (20 developers)
  • Custom quotes available
More information here.

Development resources

Development resources are not important for users, but are for developers. Great documentation and manuals can save hundreds of hours of valuable developer time otherwise spent browsing through docs, googling, or waiting for a ticket to be addressed by a grid’s tech support.

So far, here’s our rating on how good the development resources are for the grids (subjective, yet pretty accurate):

  1. ag-Grid– Excellent documentation and examples. This includes materials about its Angular/React components and integration with third party software, such as OpenFin.

  2. Webix– Almost as good as ag-Grid. The grid provides tons of examples and live demos, API is very well documented and easy to search and navigate. Integration with Angular/React could be covered better.

  3. PrimeNG– Nice documentation and examples but lacks built-in search.

  4. SlickGrid– Documentation looks a bit fragmented. Plenty of examples and demos are available.

  5. HyperGrid– No manuals are available. Documentation is very basic and lacks descriptions. Most of the examples provided in the repo do not work and styling information is hard to find. The project is currently in a transitional phase; the new codebase has emerged, but infrastructure and support is falling behind. After figuring it out and creating a demo, we became very popular on Wall St as the Folks Who Figured it Out.

Conclusion

We took a look at some of the great modern web grids. Test results prove the point that web interfaces combined with modern technologies can provide a highly responsive and well performing user interface.

In this testing, the winners are:

  1. SlickGrid: A bit old, but lightning fast and very easy to use.
  2. HyperGrid: A very promising technology that may become mainstream in the future. Second place is only due to the situation with documentation/manuals, which we believe will be improved soon.
  3. Webix: Excellent performance in all categories, great API and documentation.

Honorable mention: ag-Grid. It wasn’t the fastest, but it was fast enough for most enterprise users’ needs, and its focus on integration with React, Angular and other mainstream frameworks, along with tech support and excellent documentation can be the key advantages to choose this grid.

Everybody had a different use case and requirement, hopefully these results can help steer you in the right direction and help manage your expectations. As you can see, some of the grids were more performant along several dimensions so that gives you some choice and ability to cater to your specific requirements. Thanks to the AMPS JavaScript client, AMPS-powered web applications can be easily built and deployed. For users who want to try these grids in action, we’ve prepared a GitHub repository with the sample projects for each grid used in the above tests. Each project also includes the AMPS configuration file and quick start instructions. Did we miss something? Do you know a great grid we should totally try? Let us know what you think!


* While Chrome and Firefox demonstrated similar performance on both Windows and Linux, Edge was different. On average, Edge performed 35% worse with ag-Grid, 50% worse with SlickGrid, had similar performance with HyperGrid, but, did notably better with Webix – 3-5 times faster than Chrome. We would appreciate any comments on why Edge works this way and how to improve its performance with other grids.

Protobuf: Battle of the Syntaxes

$
0
0

fighting robotsGoogle Protocol Buffers, or protobuf for short, is a method for serializing a message using a strict schema. AMPS has supported the Proto2 syntax of protobuf since AMPS 5.0, but up until now has not supported the Proto3 syntax for reasons we will discuss shortly. With the release of support for the Proto3 syntax in AMPS 5.2.1.0, I’d like to highlight the differences between the two syntaxes and the impact those have on AMPS. Let’s start by giving a brief overview of protobuf.


What is a Protobuf?

As stated earlier, Protobuf messages must follow a specific schema. Message schemas are defined in a .proto file. The protoc compiler is then used to generate a language specific implementation of your message schema. Here is an example of a .proto file written using the Proto3 syntax.

syntax="proto3";packageMyNamespace;messageMessage{stringFoo=1;stringBar=2;int32ID=3;}

As you can see, this schema defines a message with 3 fields, 2 strings and an integer. Fields may also consist of sub-messages that are defined in the same protofile, or any imported protofiles. If this was a schema for a Proto2 message, each field would need to be tagged with either optional or required, but more on that later. In the Proto3 syntax, everything is optional. If you do not provide a syntax, Proto2 will be used and a warning similar to the following will be displayed in the log file.

No syntax specified for the proto file: example.proto.
Please use 'syntax = "proto2";' or 'syntax = "proto3";'
to specify a syntax version. (Defaulted to proto2 syntax.)

Now, let’s go over some of the highlights of the Proto2 and Proto3 syntaxes.

Proto2 vs. Proto3

The Proto2 and Proto3 syntaxes are quite similar, but have some distinct differences. To begin this comparison, I’m going to highlight some of the features of Proto2 that are not present in Proto3. These features include, but are not limited to:

  1. Required message fields. This can be useful for things like SOW keys.
  2. Ability to set custom default values for a field.
  3. Ability to determine if a missing field was not included, or was assigned the default value. This is needed for AMPS to use delta messaging.
  4. Support for nested groups.

The Proto3 syntax contains the addition of many new features that were not present in the Proto2 syntax, as well as the removal of some existing features. These changes include:

  1. Removal of required fields.
  2. Removal of default values. Primitive fields set to a default value are not serialized.
  3. Addition of JSON encoding instead of binary protobuf encoding.
  4. Extensions have been replaced by the Any type.
  5. Addition of well-known type protos. These include any.proto, timestamp.proto, duration.proto, etc.
  6. Strict UTF-8 checking is enforced.

At the time of writing this, several Proto3 features have been back-ported to Proto2. These features are the following:

  1. Addition of Maps.
  2. Addition of a small set of standard types for time, dynamic data, etc.

A complete list of the changes between Proto2 and Proto3 can be found in the Proto3 Release Notes.

Limitations of Protobuf

Deciding which version of protobuf to use really comes down to your application’s needs. Both versions of Protobuf have limitations in AMPS, but Proto3 has some more serious limitations to consider. Before addressing this, let’s take a look at the restrictions that apply to Proto2 and Proto3.

  1. A protobuf message can be an UnderlyingTopic for a View, but it cannot be the outbound message type.
  2. Subscriptions to AMPS internal topics cannot be a Protobuf message. An example of this would be the /AMPS/ClientStatus topic.
  3. The Protobuf module will not be loaded into AMPS if your host does not have GLIBC version 2.5 or newer.

In short, these restrictions exist because of the strict, fixed definition of a message.

In addition to the above restrictions, Proto3 message types have an additional restriction of being unable to use delta publish or delta subscribe. This is because Proto3 has fixed default values, and does not serialize any field that matches the default. This leaves AMPS in a situation where it is unable to determine if the omitted field was intentionally left out, or if it was supposed to be set to one of the pre-defined default values. For this reason we made the decison to not support delta messages with Proto3. If you send AMPS a delta publish or subscribe command, the command is converted to its non-delta form. In the case of subscriptions, we will log a message similar to the following:

warning: 02-0027 client[client_name] delta_subscribe: message 
type protobuf-message-type does not support delta; request 
converted to a subscribe.

This is important to keep in mind should you decide to convert from Proto2 to Proto3. With the exception of these limitations, Protobuf is a fully supported message type inside of AMPS.

Choosing a Syntax

It is hard to make a general recommendation of which version of protobuf to use, but there are some recommendations. For those of you already using Proto2 successfully, it is recommended that you stay with the Proto2 syntax since there is some API incompatibility between Proto2 and Proto3. Beyond that, I have created a few questions that you must ask yourself before choosing a syntax:

  1. Do you intend on using delta messaging?
  2. Are there any fields that you require in every message, and would like to fail if it is not there?
  3. Do you have a need to assign custom default values for each field?
  4. If a default value is received, custom or otherwise, would you need to know if it was omitted or set to the default?

If you require any of these features, then you’ll need to use Proto2. If your application’s needs do not include these features, then the choice is yours.

Configuring AMPS

In order to configure AMPS to use protobuf, you will need to import a .proto file containing the schema for the messages that will be sent over a transport. This means that you will need to define a MessageType for each .proto file that you intend to use. If your .proto file uses the protobuf method of including another .proto file, then you will only need to specify the main .proto file. That being said, all .proto files must be located at one of the ProtoPath locations. Here we only have one ProtoPath.

<MessageType><Name>my-protobuf-messages</Name><Module>protobuf</Module><ProtoPath>proto-archive;/mnt/shared/protofiles</ProtoPath><ProtoFile>proto-archive/person.proto</ProtoFile><Type>MyNamespace.Message</Type></MessageType>

This example, taken from the AMPS User Guide, shows a standard way to define your protobuf message type. AMPS will import the .proto file and identify the syntax of the file automatically. There is no change to the configuration between the Proto2 and Proto3 syntaxes.

Publishing a Message

In order to publish a protobuf message into AMPS, you must first create and serialize the message. This is done using the protobuf generated files. Once you have serialized your data, publish it to AMPS like you would any other message type. Here is an example using python:

# Import the generated fileimportperson_pb2# First we need to create an object of the protobuf messageprotobuf_record=person_pb2.Message()# Now we need to populate itprotobuf_record.Foo="60East"protobuf_record.Bar="AMPS"protobuf_record.ID=60# Serialize the messageserialized_message=protobuf_record.SerializeToString()# Let's publish itclient.publish("my-protobuf-messages-topic",serialized_message)

Closing Thoughts

Though AMPS supports both Proto2 and Proto3, Proto2 is more feature rich due to restrictions of the message type. Both versions of protobuf have their advantages and disadvantages, and the best choice really does come down to the needs of your application. If you are already successful with Proto2 and do not require a feature added in Proto3, then you should stick with Proto2. If you’re just starting out with Protobuf and the restrictions don’t affect you, then you should consider Proto3. Much of the information provided here and more is available in the Protobuf section of the User Guide.

You Shall Not Pass: Banning Misbehaving Clients with fail2ban

$
0
0

close up of rusty hammerOne of the most enjoyable parts of AMPS is how easy it is to create a client, connect to an AMPS instance, and start building an application. In just a few minutes, you can have applications communicating through AMPS and start working out your application’s message flow. (In fact, we’ve demonstrated live-coding a basic chat application from scratch in under 30 minutes!)

If you’re responsible for keeping a common development instance of AMPS running, that joy can sometimes turn to frustration as misbehaving applications can end up consuming resources on the instance. In extreme cases, misbehaving applications can consume enough resources that other applications are affected.

We’ve seen instances where a misconfigured application generated millions of failed connections in less than two hours. While AMPS did a reasonably good job of managing the flood, the overhead involved in managing those failed connections consumed bandwidth and CPU time that would have been better spent doing real work for the instance.

There’s a simple solution, though.

fail2ban: Better than a Wizard

Managing misbehaving connections isn’t a problem unique to AMPS. Web servers, SMTP servers, ssh servers, databases – any software that accepts connections over a network needs to handle this problem. Ideally, with as little CPU overhead and network overhead as possible.

In fact, most modern Linux distributions already provide a service that does this protection: fail2ban. Commonly used to protect critical services like SSH access, Apache, ngnix and so on, fail2ban has exactly the features we need to protect an AMPS instance.

The idea behind fail2ban is simple. The fail2ban service monitors logs for entries that indicate a problem from a specific remote IP address. If the number of problem entries exceeds a configured threshold, fail2ban updates the firewall rules for the system to block access from the problematic system to the affected port for a period of time.

With some simple configuration, you can easily configure fail2ban to protect AMPS instances.

There are a few pieces of the recipe that we need to use fail2ban.

  • Setting policy First, we need to decide what we consider to be behavior that we want to protect AMPS from.
  • Logging events Then, we need to log the information that we’ll use to identify when connections are misbehaving.
  • Identifying problems Next, we need to let fail2ban know what events should be considered bad behavior.
  • Configuring protection Finally, we’ll configure how fail2ban protects AMPS from bad behavior.

Setting policy

For the purposes of this blog, we’ll set a policy that protects AMPS from two common problems: repeated connections from clients that have the same name (“name in use” collisons) and repeated connections from clients that do not successfully authenticate to AMPS.

When we see a client misbehaving in either of these ways, we want fail2ban to block connections from that client for two minutes. If a client has more than 20 failures due to entitlement or name in use in 10 seconds, we’ll trigger the ban.

Logging Events

Now that we have a policy to enforce, we need to capture the events for fail2ban.

To enforce the policy we just set, we need to know when a client disconnects and why that client disconnected. For fail2ban to successfully ban the client, we’ll also need information on the IP address that the client is connecting from.

Recent patch versions of AMPS 5.2 (that is 5.2.1.37, 5.2.0.87 and subsequent versions) contain all of the information we need for this monitoring in the 07-0013 log message.

To capture this information in a place that’s easy for fail2ban to monitor, we add a distinct logging target to AMPS configuration.

<Target><Protocol>file</Protocol><IncludeErrors>07-0013,00-0015</IncludeErrors><FileName>/var/log/amps/ban.log</FileName><RotationThreshold>1MB</RotationThreshold></Target>

Notice that there’s no logging level specified in this Target. The ban.log file will only contain the specific error that we need fail2ban to monitor, 07-0013, and 00-0015, which ensures that AMPS will write at least one event to the logging file, even if there are no disconnects happening. Also notice that the file has a consistent filename, so fail2ban can easily find it, and that AMPS will write 1MB of logs and then roll the log over onto the same file name: AMPS will keep the file size at approximately 1MB.

This file captures disconnect events from the server. For example, the following set of events shows three clients disconnecting from the server.

2017-12-07T16:55:49.9395590-08:00 [26] info: 07-0013 client[queue-reader-dirkm](192.168.0.7:50336) disconnected: connection closed.
2017-12-07T16:56:12.2582980-08:00 [26] info: 07-0013 client[daily-report](192.168.1.1:50344) disconnected: connection closed.
2017-12-07T16:59:57.2596670-08:00 [27] info: 07-0013 client[fast-message-loader-3218](192.168.2.0:50342) disconnected: connection closed.

The states that we’re looking for are the auth state (indicating that a client isn’t authorized to log on) or the name in use state (indicating that a client was disconnected due to the name being in use).

Identifying Problems

Once AMPS is recording messages in a format that fail2ban can consume, the rest of the configuration is easy.

The log message is built to be relatively easy to scan for, so the filter to fail2ban is simple. Create this amps.conf file in the /etc/fail2ban/filter.d directory (or the equivalent directory for your Linux distribution):

# Fail2ban filter for AMPS (action-based file format)[INCLUDES]before= common.conf

  [Definition]# Notice that you could also update the regex to# track specific reasons for disconnection (for# example, you could specify that fail2ban only# tracks name in use or entitlement failures).failregex= info: 07-0013.*\(<HOST>:[\d]+\) disconnected: (auth|name in use)

The regular expression here indicates that a 07-0013 message with a disconnection reason of auth or name in use is an event that should be monitored. Further, the IP address for the event is the first part of the host:port string that is in parentheses just before the word disconnected.

Configuring Protection

Now that we have a rule that tells fail2ban how to identify problem disconnects, all that’s left is to configure fail2ban to protect the host from the problem.

We add an amps rule to /etc/fail2ban/jail.local (or the equivalent file in your distribution). That file defines rules that are customized for the local system, rather than provided by default with the distribution.

[amps]enabled=trueport= 9007
  logpath= /var/log/amps/ban.log
  maxretry= 20
  bantime= 120
  findtime= 10

The name at the top of the section, [amps], matches the name of the rule file we created for AMPS in the filter.d directory.

The maxretry setting specifies the number of failures that a given host is allowed to have during the findtime period. The bantime specifies how long to block connections.

The settings here say that if an IP address has logged 20 or more disconnect messages in the last 10 seconds, ban that IP address for 120 seconds. Naturally, you can tune these settings to best fit your installation. The ban applies to the specified ports – if your AMPS instance uses different (or additional) ports, replace the port parameter in the configuration.

Easy As A Banhammer

That’s all there is to it. Restart fail2ban, and misbehaving clients will no longer be able to disrupt your AMPS instance.

Meltdown and Spectre Performance Implications

$
0
0

Spectre and Meltdown logosOver the last several days, the technology world has been focused on the impact of the Meltdown and Spectre vulnerabilities. There are several good articles published about these vulnerabilities, among them coverage from The Register and an overview from Red Hat.

In all of these discussions, there’s a common thread: the kernel fixes for these vulnerabilities will carry a performance cost. The question is – how much of a cost?

Now that some of the patches are available for Meltdown and Spectre, we’re able to provide guidance on how these patches will impact performance critical AMPS deployments. Let’s start by saying that the degradation you’ll see from these patches is highly dependent on your workload and features of AMPS you’re using.

Red Hat’s Performance Team has provided guidance on workloads and the expected performance degradation which I’m copying here for easier reference: https://access.redhat.com/articles/3307751.

In order to provide more detail, Red Hat’s performance team has categorized the performance results for Red Hat Enterprise Linux 7, (with similar behavior on Red Hat Enterprise Linux 6 and Red Hat Enterprise Linux 5), on a wide variety of benchmarks based on performance impact:

  • Measureable: 8-19% - Highly cached random memory, with buffered I/O, OLTP database workloads, and benchmarks with high kernel-to-user space transitions are impacted between 8-19%. Examples include OLTP Workloads (tpc), sysbench, pgbench, netperf (< 256 byte), and fio (random I/O to NvME).

  • Modest: 3-7% - Database analytics, Decision Support System (DSS), and Java VMs are impacted less than the “Measurable” category. These applications may have significant sequential disk or network traffic, but kernel/device drivers are able to aggregate requests to moderate level of kernel-to-user transitions. Examples include SPECjbb2005, Queries/Hour and overall analytic timing (sec).

  • Small: 2-5% - HPC (High Performance Computing) CPU-intensive workloads are affected the least with only 2-5% performance impact because jobs run mostly in user space and are scheduled using cpu-pinning or numa-control. Examples include Linpack NxN on x86 and SPECcpu2006.

  • Minimal: <2 % Linux accelerator technologies that generally bypass the kernel in favor of user direct access are the least affected, with less than 2% overhead measured. Examples tested include DPDK (VsPERF at 64 byte) and OpenOnload (STAC-N). Userspace accesses to VDSO like get-time-of-day are not impacted. We expect similar minimal impact for other offloads.

AMPS Workload Estimates

Transaction Log/Message Queues/Replication: Use cases with a Transaction Log concerned with performance are typically using a PCIe or NVMe storage device and involve significant networking, which crosses into the kernel space frequently. Our performance simulator for using AMPS within a large trading system sees just under a 12% performance degradation (both in maximum achievable throughput and increase in median latency), however this extreme simulation spends significant time in the kernel and minimal time in user mode. We expect these use cases to fall in the range between upper-end of the Modest and the lower end of the Measurable impact range of 5-12%.

Large Scale View Server Where AMPS is spending most of its time executing user mode code (SOW queries, content filtering, delta publish/subscribe, etc.) should see an impact in the Small range.

Other Considerations and Mitigation

PCID support: To minimize the impact of these patches, verify your systems have PCID enabled. Without this feature, the patches will yield a higher performance impact. You can verify your host environment has PCID support by verifying the pcid flag is reported in your /proc/cpuinfo flags row (or in your lscpu flags output if you have that command available):

$ lscpu | grep pcid

Flags:                 fpu vme de pse tsc msr pae mce cx8 apic
sep mtrr pge mca cmov pat pse36 clflush dts acpi mmx fxsr sse
sse2 ss ht tm pbe syscall nx pdpe1gb rdtscp lm constant_tsc
arch_perfmon pebs bts rep_good nopl xtopology nonstop_tsc
aperfmperf eagerfpu pni pclmulqdq dtes64 monitor ds_cpl vmx smx
est tm2 ssse3 fma cx16 xtpr pdcm pcid dca sse4_1 sse4_2 x2apic
movbe popcnt tsc_deadline_timer xsave avx f16c rdrand lahf_lm
abm epb invpcid_single spec_ctrl ibpb_support tpr_shadow vnmi
flexpriority ept vpid fsgsbase tsc_adjust bmi1 avx2 smep bmi2
erms invpcid cqm xsaveopt cqm_llc cqm_occup_llc dtherm arat pln
pts

Kernel Bypass Technologies: Using Kernel bypass technologies such as OpenOnload is a great way of minimizing the impact from these patches. If you’re already using these technologies, then your impact from these patches will be far less than those not using them.

What’s Next

We’ll keep this post updated with any new findings or suggestions. If you have any questions, please don’t hesitate writing comments below.

Easy Authentication and Entitlements

$
0
0

elegant key and keyholeOne of the most common requirements for AMPS instances is integration with an enterprise security system. In this blog post, we’ll show you the easiest way to get an integration up and running – by building an authentication and entitlement system from scratch!


In versions of AMPS prior to 5.0, the only way to integrate with an enterprise system was to create a server module to handle authentication and entitlement. AMPS version 5.0 and later include an optional module that can use a RESTful web service for authentication and entitlement. Using this module can be the easiest way to integrate into an existing system.

In this blog post, we’ll:

  1. Explain how the module works
  2. Show you how to configure AMPS to use a simple authentication web service
  3. Give you a simple sample implementation of a web service using Flask

That might sound like a lot of ground to cover, but don’t worry – this is a lot simpler than you might expect, and the Flask framework in this blog is a great starting point to use for a production-ready system, whether you’re developing a standalone service or a fully-featured integration with an existing system.

All of the code discussed here is available in a public github repository. And to give credit where credit is due, the technique for using Basic authentication with Flask is developed from a post by Armin Ronacher on the Flask snippets site.

AMPS Authentication and Entitlement

The AMPS authentication and entitlement system is designed to be straightforward.

Authentication happens when a connection logs on. The request for authentication contains a user name and a token (perhaps a password, perhaps a certificate, perhaps a single-use token).

Entitlement happens when a particular user name first requests a particular type of access to a particular resource. (For example, reading data from a particular topic by subscribing to the topic, or publishing to a particular topic.) After AMPS has checked entitlements with the module once, AMPS caches the results for future use.

So how do those steps translate to a RESTful web request?

Making it RESTful

The RESTful authentication and entitlement system does two things:

  1. Converts an AMPS logon command into an HTTP request for a permissions document, using the credentials in the logon command.
  2. Parses the permissions document and uses the permissions in that document to grant entitlements when AMPS requests an entitlement check.

That’s all there is to it.

(The full documentation for the module is in the Authentication and Entitlement using a Web Service chapter of the User Guide.)

Basics of Basic Authentication

The module supports both Basic and Digest authentication. You can read more about these in RFC7617 for Basic authentication, and RFC7616 for Digest authentication.

For this post, we’ll look at Basic authentication.

In Basic authentication, the web server (in this case, our web service) denies access to resources unless the requestor (in this case, AMPS) provides an appropriate Authorization header. If the Authorization header isn’t present, or the credentials aren’t accepted, the web server returns a 401 status with a WWW-Authenticate header that indicates that it accepts Basic authentication (and provides a token that indicates the scope of the authentication request).

It’s common for a requestor to send a request without credentials, then use the response from the server to decide what sort of authentication to use. The AMPS web service module uses this approach. When the web server indicates that it uses Basic authentication, the module returns a Authorization header with the credentials for the logon request.

GET It Done

To be able to pass credentials, the module needs to know the contents of the logon request, and the URI to use to retrieve the permissions document.

The URI is set in the module configuration (described below). The module allows you to substitute the user name of the user logging in to AMPS at any point in the URI.

To convert the logon request into an HTTP request, the module takes the user name and password and uses those to authenticate the HTTP request. The module supports both Basic and Digest authentication.

For example, AMPS receives a logon command along these lines:

{"c":"logon","cid":"1","client_name":"subscriber-AMPSGrid-Falken-host26","user_id":"falken","pw":"joshua","a":"processed","v":"5.2.1.4:java"}

The user name used for HTTP authentication will be falken, and the password used for HTTP authentication will be joshua.

If the module is configured to use http://internal-webhost:8090/{{USER_NAME}}.json as the URI, the module substitutes falken for the {{USER_NAME}} token to request /falken.json from the webserver at internal-webhost:8090.

To determine whether to use Basic or Digest authentication, the module first sends an unauthenticated request to the server. The server responds with a 401 response that contains a WWW-Authenticate header, as described above, and AMPS responds with an authenticated request along these lines:

GET /falken.json HTTP/1.0

User-Agent: AMPS HTTP Auth/1.0
Accept: */*
Authorization: Basic ZmFsa2VuOmpvc2h1YQ==

Notice that the Authorization header contains a base64-encoded representation of the username and password provided on logon.

Putting It Together: AMPS Configuration

With that background, let’s configure AMPS to use the web service module for authentication and entitlement.

First, load and configure the module:

<Module><Name>web-entitlements</Name><Library>libamps_http_entitlement.so</Library><Options><ResourceURI>http://localhost:8080/{{USER_NAME}}.json</ResourceURI></Options></Module>

Then, specify that the module is used for authentication and entitlement for the instance.

<Authentication><Module>web-entitlements</Module></Authentication><Entitlement><Module>web-entitlements</Module></Entitlement>

With this configuration, AMPS will use the web service module for authentication and entitlement for all connections to the instance, and will be looking for a service at port 8080 on the local machine.

All we need now is a web service that can use basic authentication and serve up permissions documents!

Service, Please! Coding the Web Service

While the web service module works perfectly well when requesting static documents from a web service such as Apache or nginx, for the purposes of this post, we’ll show how simple it is to use a standard HTTP application framework to build the web service.

We’ll use Flask for this sample, since it’s readily available (and we like Python!) Further, the extension points for Flask are straightforward, which makes it very handy for demonstration purposes.

To create the service, we first import the things we’ll need from Flask and define the service:

fromflaskimportFlask,request,Responsefromfunctoolsimportwraps# create the flask app exampleapp=Flask(__name__)

Next, we’ll need to define a function to return a 401 response that requests Basic authentication:

defauthenticate():"""Sends a 401 response that enables basic auth"""returnResponse('Could not verify your access level for that URL.\n''You have to login with proper credentials',401,{'WWW-Authenticate':'Basic realm="AMPS Authentication"'})

This function uses Flask to return a 401 response with an appropriate WWW-Authenticate header and a helpful message.

We also provide a function that can wrap a response: this function checks to see if the credentials provided are valid by calling a check_auth function. If so, the wrapped function is called. If not, the wrapper calls the authenticate function to return the 401 response.

defrequires_auth(f):@wraps(f)defdecorated(*args,**kwargs):auth=request.authorizationifnotauthornotcheck_auth(auth.username,auth.password):returnauthenticate()returnf(*args,**kwargs)returndecorated

This function makes it easy to validate credentials before providing a permissions document. We use wraps from the functools module to create a @requires_auth decorator for a function. What this means in practice is that, once we’ve defined this function, we can easily require successful authentication for a function by adding the @requires_auth decorator on a function.

The Flask infastructure handles decoding and parsing the Authentication header, so all we have to do is pass the values along to the check_auth function.

Now, the infrastructure is in place – all we have to do is write two functions: check_auth to verify the username and password, and a function to return a permissions document given an authenticated username.

For sample purposes, we just hard code the username and password in the authentication function:

defcheck_auth(username,password):"""This function is called to check if a username/password is valid."""returnusername=='falken'andpassword=='joshua'

Of course, in a real system, this check could do anything that it needs to, including calling out to an external system to verify the credentials.

Last, we define a function that, given an authenticated user name, returns the permissions for that user. For demonstration purposes, we just return a hard-coded JSON document. We use the wrapper defined earlier to ensure that control only enters this function if the username and password are validated by check_auth.

@app.route('/<username>.json')@requires_authdefpermission_document(username):return"""        {"logon": true,"topic": [{"topic": ".*","read": true,"write": true            }],"admin": [{"topic": "/amps/administrator/.*","read": false,"write": false            }, {"topic": ".*","read": true,"write": true             }]        }"""

This function is called for any HTTP request that matches the /<username>.json pattern. The function is only invoked after the requires_auth wrapper accepts the credentials in the request.

This permissions document grants logon access to the instance, and allows full read and write of any topic. For the admin console, the document allows access to any resource except those under the /amps/administrator path. As usual, the full syntax for the permissions document is described in the User Guide.

Last, we need to start the server when the script is loaded:

if__name__=='__main__':app.run(host='0.0.0.0',port=8080)

… and that’s it! With those few lines of configuration and code, we have a working authentication and entitlement system.

Would You Like To Play AMPS?

With AMPS configured as shown above and the simple Python script running, we can try out the authentication and entitlement system (remember, both the configuration and script are available from the github repository.)

We first start AMPS:

$ ampServer config.xml 
AMPS 5.2.1.92.210270.984c1d9 - Copyright (c) 2006-2017 60East Technologies Inc.
(Built: 2018-03-17T23:01:09Z)
For all support questions: support@crankuptheamps.com

And then start the authentication and entitlements service:

$ python auth/main.py
 * Running on http://0.0.0.0:8080/ (Press CTRL+C to quit)

Then, you can use the ping command in spark to test the credentials.

First, try with valid credentials.

$ spark ping -server falken:joshua@localhost:9007 -type json
Successfully connected to tcp://falken:*@localhost:9007/amps/json

Then, try with credentials that the authentication and entitlements service doesn’t recognize:

$ spark ping -server matthew:ferris@localhost:9007 -type json
Unable to connect to AMPS (com.crankuptheamps.client.exception.AuthenticationException: Logon failed for user "matthew").

It’s just that simple!

Where Next?

You can use this Flask framework as the foundation for a more fully-featured system by replacing the check_auth and permission_document functions. If you need to integrate with a back-end system, you can use the check_auth function to check the credentials with that system and respond accordingly. Likewise, the permission document format has been designed to be easy to construct, so you can translate whatever format your existing permissions system uses into the permissions document provided back to AMPS.

Or, if you prefer another framework for creating an HTTP server, you can use the basic pattern here to quickly implement a server in your framework of choice. It’s up to you!

What HTTP framework do you prefer, and what authentication and entitlement systems are you integrating with? Let us know!

Happy Birthday to AMPS!

$
0
0

candles with the number 10This month marks the 10 year anniversary of AMPS being deployed into production environments, helping to fuel the global financial markets. Those first customer deployments built on AMPS are still in production, and are still critical infrastructure today!

Since then, AMPS has become a key part of critical trading flow at the top financial institutions. We’ve done this thanks to our close relationships with users. With their partnership and investments into our R&D, we’ve grown AMPS to the product it is today.

The secret to our success is simple:

  • Partner with the developers using AMPS and the operations teams supporting AMPS
  • Consider the whole platform when making changes
  • Stick to our principles
  • Every engineer works with customers

We have some exciting things coming up to help take AMPS into the future. In the meantime, though, we wanted to take a minute to say THANK YOU to all of the people who have partnered with us to build their most important infrastructure on AMPS.

We couldn’t have done this without you – and the next decade will be even better!


Managing Large Topics in the SOW

$
0
0

elegant gear patternOne of the most popular features of AMPS is the State-of-the-World (or SOW), which allows applications to quickly retrieve the most current version of a message. Many applications use the SOW as a high-performance streaming database, quickly retrieving the current results of the query and then automatically receiving updates as changes occur to the data.

For maximum performance, 60East recommends making sure that all topics in the SOW (including views and conflated topics) fit into memory.

Some applications, though, require larger data sets. We’ve seen applications in production with data sets several times as large as physical memory. We’ve successfully tested SOW topics as large as 8TB on a system with 128GB of memory (a topic that is more than 60 times as large as physical memory).

AMPS version 5.2.2 introduces a new algorithm for State-of-the-World memory utilization that can greatly improve the memory efficiency and decrease the memory pressure of large SOW topics on hosts. This new algorithm applies to persistent SOW topics covered by the Transaction Log.

File-backed SOW topics that are not covered by a Transaction Log are memory mapped such that as a SOW topic grows beyond the available physical memory of the host environment, the OS will “page” the SOW topic data from memory out to the storage device and from the storage device into memory on-demand.

SOW topics covered by a Transaction Log are mapped to memory as “private” mappings which counts any modified topic memory as “anonymous dirty” data that counts towards AMPS’ Out-of-memory score (aka “OOM score”) and puts the system at increased risk of swapping.

Prior to AMPS version 5.2.2, Transaction Log covered SOW topics were left in the dirty state once modified, limiting the growth of a SOW topic to the amount of memory available to the AMPS process (typically the amount of physical memory on the host plus configured swap memory).

Starting with version 5.2.2, Transaction Log covered SOW topics are “cleansed” periodically as AMPS flushes the pages to disk manually. This “anonymous clean” data does not count towards AMPS’ OOM score and thus allows AMPS SOW topics to far exceed the memory available on the host.

Considerations for Large SOW Topics

Having SOW topics that far exceed the host memory works great for many use cases, but you must be careful, since there are many things that need to be considered:

Decreased Publish Performance: When publishing to a topic that isn’t currently resident in memory, there could be significant VM “page-outs” or “page-ins” that impede publishing performance. Capacity planning up to the host memory limit could show acceptable performance that quickly degrades once the SOW topic exceeds the size of the physical memory of the host environment.

Decreased Query Performance: When querying data where the query result contains records that are not resident, the OS pages those records into memory before the query result can be constructed and sent to the querying client. Additionally, AMPS auto-indexes fields not previously queried, so executing a query with a new field XPath in a content filter can force a re-indexing of a SOW topic, creating extensive “page-in” activity while the SOW data is brought into resident memory to be parsed and indexed.

Increased Recovery Times: When AMPS starts, it checks the CRC of every record within a SOW topic to guard against corruption. To do the CRC check, AMPS needs to bring the SOW topic into memory. If you have a 1TB SOW topic stored on a fast storage device that can read 1GB/s, it could take 17 minutes (or more) for AMPS to recover the SOW topic.

Tuning Tips

If you’re contemplating running large SOW topics that exceed the memory of your host environment, here are some tips on how to tune your host environment and configurations to get the optimal performance out of your large SOW use.

Hardware

Use Fastest Available Storage: We recommend you place the SOW topic on the fastest storage available in your environment to minimize the paging costs and recovery times. It’s expected to have increased VM paging activity when in these configurations, so the faster the storage device where these large topics are persisted, the better the performance will be. See Is Your App Solid? (Does it need SSD?) for a discussion on storage options for AMPS applications.

Operating System

Apply Recommended OS Tunings: There are OS tuning parameters that can benefit large SOW use cases, which we list here. Engage your system administration teams to set these when appropriate.

Turning off Transparent Huge Pages: Transparent Huge Pages can carry a huge cost for memory management, we recommend disabling it or setting it to “madvise”.

$ echo never > /sys/kernel/mm/transparent_hugepage/enabled

Reduce Swappiness: This setting controls the preference of dropping non-dirty pages over swapping. With large SOW files, we always want to prefer dropping rarely touched, non-dirty pages over the system swapping. Therefore, we set this value to the lowest setting without disabling it entirely.

$ sudo sysctl -w vm.swappiness=1

Increase Minimum Free Bytes: Interrupt handlers and other critical OS components require memory always being available. In large, enterprise host environments the default values controlling the minimum free for these critical operations is often not large enough. We recommend setting this value to 1% of the available memory rounded up to the nearest 1GB.

$ sudo sysctl -w vm.min_free_kbytes=2097152

Disable Zone Memory Reclaim: AMPS is already NUMA aware for it’s low-latency components and doesn’t benefit from the built-in NUMA optimizations within the Linux OS for large SOWs. We recommend turning off the Zone Memory Reclaim feature.

$ sudo sysctl -w vm.zone_reclaim_mode=0

Increase Maximum Memory Mappings: One of the thresholds set in the Linux OS configuration that can cause requests for more memory to fail prematurely is the max_map_count. When set too low, AMPS can fail to increase the size of a SOW topic. Increasing this value allows us to grow further.

$ sudo sysctl -w vm.max_map_count=500000

AMPS Configuration

Use a Large SlabSize: Using a large SlabSize for your SOW topic can minimize the overhead of memory map maintenance and rate of SOW topic file extensions when growing. We recommend using 1GB slab sizes for any of your large topics.

Use a Durability of persistent: For large topics, you want to use topics with persistent durability (the default). Using transient durability topics that are large will increase swap usage and be limited in size to the sum of the physical and swap memory on the host.

Monitoring

When AMPS version 5.2.2 or greater is running on a Linux OS with kernel version 3.14 or greater, it is recommended you monitor how much memory the host has available before swapping. This metric is exposed in the AMPS HTTP Admin in the /amps/host/memory/available path.

Testing

When testing the performance of large SOWs on runtime and recovery performance, it’s easy to be fooled by effects of the page-cache that make test results inconsistent between consecutive runs. When testing for recovery performance, we advise that you purge the page caches between AMPS lifetimes to achieve worst-case testing with your data, AMPS version, and host environment. Dropping the Linux page caches require root privileges and can be done as follows:

$ echo 1> /proc/sys/vm/drop_caches

Go Big

The AMPS State-of-the-World is suitable for large caching and computation modeling applications, for example market data caches or XVA modeling. In this post, you’ve seen the best practices and tuning recommendations 60East has developed over the course of working with many large data applications.

For any system, we highly recommend capacity planning to ensure that the resource needs of the system are well understood, and we recommend spending time carefully testing the throughput and capacity of the system. As always, if you have questions about how best to design your application or configure AMPS, let us know at support@crankuptheamps.com.

Metadata Magic with New AMPS Functions

$
0
0

magician holding a magic top hat and wandFrom the beginning, AMPS has been content aware. Most AMPS applications use content filtering, and features like the State-of-the-World, delta messaging, aggregation, and message enrichment all depend on AMPS being able to parse and filter messages.

The key to content filtering and message manipulation is the AMPS expression language. The expression language provides a format-independent way of working with content, and is extensible with server-side plugin modules.

As useful as the expression language is, up until AMPS 5.2.4.1 AMPS expressions could only refer to:

  • The contents of the message itself (using XPath-based identifiers), or
  • Context-free functions (like UNIX_TIMESTAMP())

These two types of functions are enough for working with data, but for monitoring and administration, it’s sometimes more important to be able to describe the message itself, rather than being limited to the content of the message. For example, it was difficult to filter a subscription to just publishes being submitted by a specific publisher or from a specific set of IP addresses or below a certain payload size.

Enter the client and message functions of AMPS 5.2.4.1! With these functions, you can write expressions that describe the message itself or the connection that published the message. These aren’t necessarily functions that every application needs. On the other hand, if you’ve ever tried to quickly find whether a message has been read from a SOW topic, or you want to get all the messages that a specific publisher is submitting, the new functions make magic possible!

In this post, I’ll show how to use some of these functions to answer some common requests. (Full descriptions of these functions are available in the AMPS User Guide.)

The post will focus on the following functions:

Function nameDescription
LAST_UPDATED()The last time a message in a SOW topic was published to.
MESSAGE_SIZE()The size, in bytes, of the data within a message.
REMOTE_ADDRESS()The address (typically IP address) of the connection executing the command.
USER()The authenticated user name of the user executing the command.

Finding Older Messages

One common request is to be able to find messages in a SOW topic that haven’t been updated for a certain interval of time. Before AMPS 5.4.2.1, being able to run this query would depend on adding a timestamp field to the data (typically through enrichment).

With AMPS 5.4.2.1, though, we can use the LAST_UPDATED() function to access the last time the record was updated. With the UNIX_TIMESTAMP() function, it’s simple to write a query that finds records that haven’t been updated in the last five minutes. Using the spark utility, all we have to do is provide the filter UNIX_TIMESTAMP() - LAST_UPDATED() > 300.

$ spark sow -server myserver:port -type json -topic sampleTopic \
            -filter 'UNIX_TIMESTAMP() - LAST_UPDATED() > 300'

For each message in the topic, AMPS subtracts the timestamp for the last time the message was updated from the current timestamp. If the difference is more than 300 (300 seconds, that is, five minutes), the filter is true and AMPS returns the message.

A filter like this could also be used in a sow_delete command to find and remove messages that haven’t been active in a certain interval of time.

Query Versus Subscription

Notice that for the command above, I used sow rather than subscribe or sow_and_subscribe. There’s an important reason for this: AMPS evaluates filters against a message when a sow query runs, or when there’s a change to the message. That means that a filter like UNIX_TIMESTAMP() - LAST_UPDATED() > 300 is very useful for a query, but isn’t very useful for a subscription.

Here’s why: imagine a message hasn’t been updated in 298 seconds when someone issues a sow_and_subscribe with this filter. The message doesn’t match during the sow part of the command, so it isn’t returned with the query results. After 2 more seconds, the message would match the filter. However, AMPS doesn’t re-evaluate the message against the filter until the message changes, so the subscription doesn’t receive the message. (If someone does publish to the message, that will reset the LAST_UPDATED() value, and the message would no longer match.)

Message Provenance

In some applications, it’s very important to be able to reliably identify the source of a change. In versions prior to 5.2.4.1, the most commonly used pattern was to require each publisher to annotate changes with the user name of the person making the change, while using an entitlement filter to guarantee that the annotations matched the expected user name.

With 5.2.4.1, you can use the USER() function with enrichment to have AMPS directly annotate each change. This makes things simpler for publishers, and can also provide information that was not previously verifiable.

For example, the following simple topic annotates each publish with the authenticated user name of the connection submitting the publish and captures the address from which the publish originated.

<SOW><Topic><Name>change-source-sample</Name><MessageType>json</MessageType><FileName>./sow/%n.sow</FileName><Key>/id</Key><Enrichment><Field>CONCAT(USER(), ' connected from ',
                       REMOTE_ADDRESS())
                AS /lastChangedBy</Field></Enrichment></Topic></SOW>

Since enrichment modifies the message before the message is written to the transaction log, the enrichment is also captured in the transaction log for an embedded audit trail.

Calculating Message Size Statistics

An important factor in capacity planning is understanding message sizes. Estimates before a system goes into production are helpful, but as a system comes online, more precise data is available and can be used to validate (or correct) the initial estimates. Likewise, for views, it can be inconvenient to persist the contents of the view to be able to estimate averages.

With the MESSAGE_SIZE() function and aggregated subscriptions, it’s easy to calculate metrics over a topic in the state of the world.

For example, the following spark query computes basic message size metrics for a SOW topic or view:

spark sow -topic test -server localhost:9007/amps/json -opts \'projection=[sum(message_size()) as /totalSize,\             max(message_size()) as /biggestMessage,\             avg(message_size()) as /averageSize,\             stddev_samp(message_size()) as /stdDev],\ grouping=[/nullValue]'

Notice that, since we want to calculate a single value for the entire topic, the spark command deliberately sets grouping to a field that isn’t in the messages. The result is that all the messages in the topic are in the same group, and the metrics are computed over the entire topic.

Data Up Your Sleeve

Just as every good magic trick relies on skill and knowledge, using the new metadata functions well also requires some understanding of how AMPS works and what functions are available when.

The simple rule to follow is that a metadata function returns meaningful results if AMPS has the information to provide, and NULL otherwise.

For example, AMPS can only provide a LAST_UPDATED() value for messages that are in the State of the World. If there’s no State of the World (that is – AMPS isn’t persisting messages in a way that they can be queried), then there’s no way for AMPS to calculate LAST_UPDATED(). Likewise, since AMPS only assigns bookmarks to messages that are stored in the transaction log, the BOOKMARK() function only returns a value for that function for topics that are stored in the transaction log.

The AMPS User Guide lists the circumstances under which each of the functions returns a non-NULL value.

Tricks of the Trade

In this post, we’ve just scratched the surface of the functions available and the ways that those functions can be used.

Have a recipe that isn’t listed here? Know a great trick for monitoring AMPS with these functions, or have a cool technique that isn’t mentioned here? How will you use the new functions?

Let us know in the comments!

Monitor your AMPS instances with Prometheus and Grafana

$
0
0

a light bulb with Earth as a light source

Modern data processing systems are complex and often consist of several sub-systems from various vendors where each individual subsystem typically exposes some sort of monitoring interface with its own metrics, format, authentication and access control. In order to keep such complexity under control and be able to monitor whole system state in real-time and in the past, standard monitoring packages have emerged. These days, most customers we work with use off-the-shelf monitoring software rather than building monitoring systems from the ground up.

One popular package is Prometheus. Prometheus is an open-source product created to collect and aggregate monitoring data and stats from different systems in a single place. Prometheus conveniently integrates with Grafana, another open source tool that can visualize and present monitoring stats organized in dashboards. In this post, I’m going to demonstrate how to integrate the built-in AMPS Admin API with Prometheus, and thus, with Grafana in order to monitor and visualize various AMPS metrics.

To make this demo work, we’re going to need to do a few things:

  • configure AMPS Admin API
  • create a data exporter that exposes data from AMPS Admin API in a format recognized by Prometheus
  • configure Prometheus to use the AMPS data exporter
  • configure Grafana to use Prometheus as a data source

As usual, all of the files used in this article are available on Github.

If you’ve never worked with Prometheus or Grafana before, you can find detailed quick start guides here:

Configure AMPS Admin API

AMPS has a built-in Admin module that provides metrics using a RESTful interface. All it takes to enable the monitoring and statistics interface is to add the Admin section in the AMPS configuration file:

<AMPSConfig>
    ...

    <Admin><InetAddr>8085</InetAddr><FileName>stats.db</FileName><Interval>1s</Interval></Admin>

    ...
</AMPSConfig>

If your configuration already has the Admin API enabled, just take note of the port number used for the Admin API.

Otherwise, you can simply add the Admin section that exposes the Admin API at the specified URL (http://localhost:8085) and also stores stats in a file (stats.db)

Once you’ve prepared the configuration file, start AMPS. The full configuration file for the demo is available on Github for your convenience.

The detailed description of every metric AMPS provides is available in the Monitoring guide here.

Create an AMPS data exporter for Prometheus

In order to add AMPS monitoring stats to Prometheus we will need a custom exporter. Exporters are applications that convert monitoring data into a format recognized by Prometheus. The detailed guide on how to write Exporters is available here. Depending on the language you want to use you might utilize one of the official client libraries available here. In our demo, we will be using Python since Python is simple to use and allows us to focus on the exporter’s logic. As with the configuration file, all the files mentioned in this section are in github.

Now we’ll need to create the exporter application that you can run as a python app.

First, make sure you’ve installed the dependencies for the Prometheus client:

pip install requests prometheus_client

Our exporter will need a custom collector – a special class that collects data from AMPS upon receiving a scrape event from Prometheus:

fromprometheus_client.coreimportGaugeMetricFamilyimportrequestsclassAMPSCollector(object):defget_stats(self):"""    This method collects stats from AMPS at the moment     of the scrape event from Prometheus. It can also     handle all the required authentication / custom HTTP     headers, if needed."""returnrequests.get('http://localhost:8085/amps.json').json()defcollect(self):# load currents stats from AMPS firststats=self.get_stats()# update the metrics -- add# whichever metrics you need to# monitor here.yieldGaugeMetricFamily('amps_instance_clients','Number of currently connected clients',value=len(stats['amps']['instance']['clients']))yieldGaugeMetricFamily('amps_instance_subscriptions','Number of currently active subscriptions',value=len(stats['amps']['instance']['subscriptions']))yieldGaugeMetricFamily('amps_host_memory_in_use','The amount of memory currently in use.',value=stats['amps']['host']['memory']['in_use'])# The repository has more metrics with more# advanced collection -- check it out!

To add an exposed metric, we use a GaugeMetricFamily object. For example in the above sample we expose the metric amps_instance_clients that corresponds with the number of Client objects reported in the Admin API at the /amps/instance/clients path.

Most AMPS metrics can use the gauge metric type since it’s a simple value that can be set at each interval. You can read more about Prometheus metrics types here.

The collector class only has a single required method – collect(). The collect() method is called upon a scrape event. Once called, the method is responsible for populating metrics values which are gathered from AMPS via a simple GET request to the AMPS Admin API. We request data in the JSON format by adding .json at the end of URL since JSON is easily convertible into native Python lists and dictionaries.

Second, we need to register our AMPS collector within the Prometheus client:

fromprometheus_client.coreimportREGISTRYREGISTRY.register(AMPSCollector())

Finally, we start the HTTP server supplied by the client that will be serving exporter’s data to Prometheus:

fromprometheus_clientimportstart_http_serverimporttimeif__name__=='__main__':# Start up the server to expose the metrics.start_http_server(8000)# keep the server runningwhileTrue:time.sleep(10)

The above code uses a custom collector to properly request data from AMPS and expose it to Prometheus at the moment of a scrape event. Depending on the policies at your site, you might modify the get_stats() method to add authentication / entitlement handling, if needed. More information about securing AMPS Admin API is available here.

Start the exporter application and it will expose an HTTP interface at localhost:8000 for Prometheus to scrape:

python amps-exporter.py

That’s it: our custom exporter is complete!

For more details on the Prometheus Python client, see the manual, available here.

Configure Prometheus to use the AMPS data Exporter

Now we need to configure Prometheus to utilize the new scrape target (that is, the service provided by the exporter) that we just created. To do this, add a new job to the configuration file:

global:# Set the scrape interval to every 10 seconds. # Default is every 1 minute.scrape_interval:10sscrape_configs:-job_name:'amps_stats'# Override the global default # and scrape targets to every 1 seconds. # (should match AMPS > Admin > Interval settings)scrape_interval:1sstatic_configs:-targets:['localhost:8000']labels:group:'AMPS'

In the above example, we add the job and also override the scrape_interval value to match the AMPS Admin statistics interval value we set in the first step. Since that’s the interval at which AMPS refreshes statistics, it’s not necessarily useful for Prometheus to ask for statistics on a different interval.

I’ve set the scrape_interval at the job level since several AMPS instances can be monitored, and each instance might have a different statistics interval.

Once configured, Prometheus can be started with this configuration file:

./prometheus --config.file=prometheus.yml

That’s all it takes to start collecting AMPS statistics into Prometheus!

Configure Grafana to use Prometheus as a data source

Of course, statistics are more useful if there’s a way to visualize them. That’s where Grafana comes in.

Once the data is in Prometheus, adding it to Grafana is straightforward. Navigate to Grafana and add Prometheus as a Data Source. The detailed instructions on how to do this are available here.

The only setting you’ll need to modify for our example is the URL: http://localhost:9090. After the data source is added, building the dashboard is pretty straightforward – you can choose different graphs, thresholds and re-arrange widgets on the page. Here’s the dashboard I built:

AMPS Grafana Dashboard

To Infinity and Beyond!

In this post, we’ve just scratched the surface of how AMPS Admin API can be integrated with Prometheus and Grafana. Many metrics are available and there are a wide variety of ways those metrics can be visualized. Since Prometheus can collect data from a wide variety of sources, you can also combine data on the AMPS instance with data about other parts of the application, giving you full end-to-end monitoring.

For further reading, here are some more articles about AMPS monitoring:

Have a recipe that isn’t listed here? Know a great trick for monitoring AMPS with Prometheus, or have a cool technique that isn’t mentioned here? What dashboard would you build? What other systems would you monitor together with AMPS?

Let us know in the comments!

AMPS 5.3: More Power, More Performance

$
0
0

lightning strike in a dark night 60East is proud to announce the release of AMPS 5.3 — the most fully-featured and easy to use version of AMPS yet!

Production Tested From Day One

The 5.3 release marks the full release of the features we’ve been releasing in previews for the last 18 months. The preview program was designed to quickly provide access to new features, and one measure of the success of the preview program is that most of the new features in this release have already been used in production for months, at multiple customer sites, making this the most well-vetted version of AMPS in our history.

Advanced Features for Demanding Applications

This release includes the following major features, new since 5.2:

  • Select lists, which allow a subscriber to receive a precise subset of the fields in a message, rather than having to receive the full message.
  • Priority queues, which provide the ability to deliver more important messages first, rather than providing messages in strict first-in-first-out order.
  • Full support for paginated sow_and_subscribe. With this support, a client can specify a page of messages to monitor, and receive only updates for messages in that page. This feature includes support for providing an oof message when messages leave the window.
  • Dramatically expanded set of functions for use in filters, preprocessing/enrichment, and view construction. These new functions include access to metadata for the message and the connection from which the message originated, when available.
  • Improved support for dead letter queues and poison message handling in AMPS queues
  • Performance enhancements throughout the server, including significant enhancements to bookmark replay scalability and the ability of AMPS to handle SOW topics recorded in the transaction log that are much larger than physical memory.
  • Configurable conflation intervals for acknowledgement messages. This allows applications that cannot tolerate the 1 second conflation interval to decrease the wait for acknowledgements to be returned to a publisher.
  • An optional authentication module that can use an existing Kerberos or LDAP system to verify the identity of a connection to AMPS.
  • Support for Protocol Buffers v3
  • Support for MessagePack
  • Major improvements to the Admin console, including new statistics, new views in Galvanometer, and a new “dark” theme.
  • Support for Basic Authentication in the Admin console
  • Support for HTTPS in the Admin console

We’ll be following up with more extensive blog posts on many of these features in the weeks to come.

Aside from these major improvements, this release includes dozens of smaller improvements and bug fixes. See the release history for the full list.

Upgrade In Seconds

We’re also excited about a few things that aren’t in this release. In the 5.3 release, you can upgrade your AMPS instances from 5.0 or 5.2 without running the amps_upgrade tool to process data files. AMPS 5.3 will work seamlessly with data files from a previous version. (Notice, though, that 5.3 may record data that cannot be processed by earlier versions, so while upgrade is seamless, earlier versions of AMPS do not work with the new features in 5.3 and do not support rollback).

You can also replicate between 5.2 versions of AMPS and 5.3 for the purposes of rolling and incremental upgrades. This capability is intended to help distributed teams and applications with complex topologies upgrade “in place” without the need for a service to ever completely go offline.

All of this means that an upgrade can often be as simple as stopping the running version of AMPS and restarting with the new binary. (60East recommends testing the upgrade in a development or test environment first, of course, since we’ve also added more error-prevention to the startup process.)

Cranked Up and Ready

AMPS 5.3 is available for download and ready to take on your most demanding workloads. What’s your favorite part of AMPS 5.3? Let us know – whether that’s one of the major features mentioned above, a smaller improvement, the new theme in Galvanometer, or something else entirely!

Select Lists: Data Served Up As You Like It

$
0
0

burrito loaded with ingredientsSelect Lists is a new feature introduced in our 5.3 release of the AMPS server. This feature lets you declare a subset of fields for your application to receive when querying or subscribing to a topic. AMPS client applications no longer need to receive a full message when the application will only use part of the message. This feature, when combined with existing filter functionality, provides developers with new methods to efficiently manage the volume of data flowing back to their applications from the AMPS server.

Select lists can be used to replace prior work-arounds such as declaring views on top of underlying topics, simply to provide a method to project a subset of fields from the underlying messages, back to the client application. Likewise, if an application declares an aggregated subscription only for the sake of receiving a subset of fields, select lists is an easier and more efficient way to get the same result.

Choose Your Fields

Select lists introduces a new, expressive grammar to declare which fields an application would like to receive from AMPS.

The grammar used to declare a Select List specifies a new options keyword, select= followed by a comma-delimited list of XPath identifiers for fields that you wish to grant or remove access to. You express whether you are granting or removing access by prepending a + or - immediately preceding the XPath identifiers. Examples of each of these tokens are +/included and -/excluded for requesting that AMPS include the /included field and requesting that AMPS exclude the -/excluded field, respectively. For additional details, please refer to the AMPS User Guide.

Building A Better Burrito

Let’s look at a simple example. Suppose a message lists the ingredients of a burrito.

{"id":123,"menu_item":"basic burrito","green":"lettuce","protein":"chicken","beans":"pinto","cheese":"cheddar mix","topping":"sour cream","salsa":"chipotle","tortilla":"flour"}

An application that wanted to know the full ingredients of the burrito could simply do a sow query for a burrito, as follows:

# Assume diner is a connected AMPS Client or HAClientformindiner.sow('foods','/menu_item = "basic burrito"'):printm.get_data()

This would return the original message.

An application could use a select list, though, to simply see what protein and salsa is available on a basic burrito:

# Assume diner is a connected AMPS Client or HAClientformindiner.sow('foods','/menu_item = "basic burrito"',options='select=[-/,+/protein,+/salsa]'):printm.get_data()

This query explicitly removes all fields from the message with the directive -/, then adds back the protein and salsa fields. This select list produces the following result:

{"protein":"chicken","salsa":"chipotle"}

Notice that the message contains exactly the fields requested in the select list. No other information is included – not even the key field for the SOW or the field that the query filters on.

Following this pattern, you could also easily select other versions of the basic burrito. For example, you could make a vegan burrito:

# Assume diner is a connected AMPS Client or HAClient# Vegan burritoformindiner.sow('foods','/menu_item = "basic burrito"',options='select=[-/protein,-/cheese,-/topping]'):printm.get_data()
{"id":123,"menu_item":"basic burrito","green":"lettuce","beans":"pinto","salsa":"chipotle","tortilla":"flour"}

You could also select a burrito without any beans or tortilla:

# Assume diner is a connected AMPS Client or HAClient# Low carb burritoformindiner.sow('foods','/menu_item = "basic burrito"',options='select=[-/beans,-/tortilla]'):printm.get_data()

Keeping Result Sets Lean

Dashboard client applications are a perfect fit to use Select Lists in concert with paginated subscriptions, to optimize as responsive a UI as possible!

The following example highlights how a dashboard client application would query a quotes topic using a paginated sow_and_subscribe command to request 10 messages at a time and dynamically selecting the subset of fields it would like to receive. Before select lists, AMPS would either require the user to receive all fields from the topic (possibly many more than required), create a View that would project the desired subset of fields to be returned, or use dynamic aggregation (which created and calculated an aggregation, even when the only result was to provide a few fields.

For example, the dashboard might simply return the ticker, price and quantity fields while retrieving 10 messages at a time:

# Assumes dashboard is a connect AMPS Client or HAClientdashboard.sow_and_subscribe('quotes',order_by='/ticker', \
          options='top_n=10,skip_n=10,select=[-/,+/ticker,+/price,+/qty]')

Securing Data with Select Lists

Select Lists have been built-in to all aspects of AMPS. Not only are subscribing clients able to specify a Select List for fields to be returned, but AMPS also provides select lists as part of the entitlement system. These select lists can be use to prevent users from retrieving or querying certain fields within a topic.

Below are some example Entitlement Select Lists that to demonstrate how they would be declared:

{"userId":456,"userName":"John Investor","password":"NeverGonnaGuess","secret":"Boston Red Sox fan","optional":"empty"}

In this example, the Entitlement Select List starts off by implicitly granting full access to all fields (explicitly, would specify +/) then specifying the removal of access to the /password and /secret expressions for those specific fields.

-/password,-/secret

For the message above, the result would be that the user would be able to see the userId, userName, and optional fields. Even better, if the user provides a filter that provides either the password field or the secret field, those fields will always be treated as NULL– exactly the same as if they did not exist in the original message.

Another way to use entitlement select lists is to configure an explicit removal of access to all fields, followed by granting of individual entitlement to specific fields. This expression would grant entitlement to the following fields: userId and userName.

-/,+/userId,+/userName

In this case, no matter what other fields were present in the message, this user would only be able to see the userId and userName fields. For that user, it is as though no other fields exist.

Choose Your Own Data (or Toppings)

As shown above, select lists are one more feature to help applications reduce bandwidth usage and processor consumption. Just like ordering a burrito, you can add or remove data as your application needs. Of course, also like ordering a burrito, you can only choose from the data available – you can’t order mango salsa if there’s no mango salsa available. So, for a basic burrito, you can include or remove an ingredient, but you can’t change the value of an ingredient. (If you do need to change data in a message, you can use a view, an aggregated subscription, or enrichment/preprocessing to do that, depending on your exact needs.)

With the integration into the entitlement system, select lists also provide another facet of an overall strategy for keeping data secure in AMPS. Combined with entitlement filters and the extensibility of AMPS user-defined functions, AMPS has extremely fine-grained control over access to data.

How do you plan to use select lists? How much bandwidth and processing power will you save? Let us know in the comments!

[Edited on 5/23/2019 to fix typos in text and code snippets.]

Viewing all 62 articles
Browse latest View live