Quantcast
Channel: 60East Technologies
Viewing all 62 articles
Browse latest View live

Secure your AMPS instances with Kerberos

$
0
0

kerberosKerberos has been an industry standard for authentication for many years and, as of 5.3, AMPS now ships with Kerberos support. AMPS Kerberos support is provided as one of the authentication mechanism options available via the libamps_multi_authentication module. Kerberos requires that an authentication token be generated and set by the client, so there are also client-side Kerberos authenticators implemented for each of the AMPS client libraries.

Before going any further, it’s important to note that for this post (and to use Kerberos in your environment), Kerberos infrastructure is a prerequisite. Setting up Kerberos infrastructure is beyond the scope of this article, and is something that is normally managed by a dedicated team.

Assuming that Kerberos is already set up for your environment, you will need the following for this demo to function:

  • 2 Kerberos Service Principle Names (SPNs)
    • HTTP/hostname - For securing the AMPS Admin Interface (hostname must be the fully qualified host name where your AMPS instance is running)
    • AMPS/hostname - For securing the AMPS Transports
  • A Kerberos Keytab containing the above SPNs
  • A user with Kerberos credentials (may be obtained via kinit, via a Keytab for the user or automatically during logon which is often the case for Windows/Active Directory). Note that for configuring Replication Authentication a Keytab for the user that the AMPS server will authenticate as is required.

Configuring AMPS

As documented in the Configuration Guide the Authentication element can be specifed for the instance as a whole and/or for each Transport. In the below configuration Kerberos authentication has been enabled for all transports using the AMPS SPN and then overridden for the Admin interface to use the HTTP SPN. Note that in addition to the Authentication element, libamps_multi_authentication.so must be specified as a Module in the Modules section as it is not loaded into AMPS by default.

The below AMPS configuration uses environment variables for the Kerberos configuration elements, thus before starting AMPS using this config the following variables need to be set:

  • AMPS_SPN - Set to AMPS/hostname where hostname is the fully qualified name of the host AMPS is running on.
  • HTTP_SPN - Set to HTTP/hostname where hostname is the fully qualified name of the host AMPS is running on.
  • AMPS_KEYTAB - Set to the path of a Kerberos keytab containing entries for the AMPS and HTTP SPNs.
<AMPSConfig>
    ...
    <Authentication><Module>libamps-multi-authentication</Module><Options><Kerberos.SPN>${AMPS_SPN}</Kerberos.SPN><Kerberos.Keytab>${AMPS_KEYTAB}</Kerberos.Keytab></Options></Authentication><Admin><InetAddr>8085</InetAddr><FileName>stats.db</FileName><Authentication><Module>libamps-multi-authentication</Module><Options><Kerberos.SPN>${HTTP_SPN}</Kerberos.SPN><Kerberos.Keytab>${AMPS_KEYTAB}</Kerberos.Keytab></Options></Authentication></Admin><Transports><!-- Authentication enabled via the top-level Authentication configuration --><Transport><Name>json-tcp</Name><InetAddr>8095</InetAddr><Type>tcp</Type><Protocol>amps</Protocol><MessageType>json</MessageType></Transport></Transports><Modules><Module><Name>libamps-multi-authentication</Name><Library>libamps_multi_authentication.so</Library></Module></Modules>
    ...
</AMPSConfig>

Success!

When AMPS starts up the following will be written to the AMPS log.

2019-04-23T13:51:11.2302690[1]info:29-0103AMPSauthenticationcreatingauthenticationcontextfortransport'amps-admin'2019-04-23T13:51:11.2302900[1]info:29-0103AMPSKerberosauthenticationenabledwiththefollowingoptions:[Kerberos.Keytab=/home/bamboo/blog/instance/HTTP-linux-ip-172-31-46-201.us-west-2.compute.internal.keytab][Kerberos.SPN=HTTP/ip-172-31-46-201.us-west-2.compute.internal]2019-04-23T13:51:11.2303670[1]info:29-0103AMPSKerberosauthenticationimportingservicename'HTTP@ip-172-31-46-201.us-west-2.compute.internal'2019-04-23T13:51:11.2303720[1]info:29-0103AMPSKerberosauthenticationacquiringcredentialsforservicename'HTTP@ip-172-31-46-201.us-west-2.compute.internal'2019-04-23T13:51:11.2564880[1]info:29-0103AMPSauthenticationcontextcreatedsuccessfully2019-04-23T13:51:11.2564950[1]info:29-0103AMPSauthenticationcreatingauthenticationcontextfortransport'json-tcp'2019-04-23T13:51:11.2565040[1]info:29-0103AMPSKerberosauthenticationenabledwiththefollowingoptions:[Kerberos.Keytab=/home/bamboo/blog/instance/AMPS-linux-ip-172-31-46-201.us-west-2.compute.internal.keytab][Kerberos.SPN=AMPS/ip-172-31-46-201.us-west-2.compute.internal]2019-04-23T13:51:11.2565270[1]info:29-0103AMPSKerberosauthenticationimportingservicename'AMPS@ip-172-31-46-201.us-west-2.compute.internal'2019-04-23T13:51:11.2565280[1]info:29-0103AMPSKerberosauthenticationacquiringcredentialsforservicename'AMPS@ip-172-31-46-201.us-west-2.compute.internal'2019-04-23T13:51:11.2609840[1]info:29-0103AMPSauthenticationcontextcreatedsuccessfully

Below is the logging for a successful authentication. In this log snippet we can see the following:

  • Client connection
  • Client logon (with the password field set to the base64 encoded kerberos token)
  • Logging related to the authentication process including success messages
  • Client session info
  • Logon response (with the password field set to the base64 encoded kerberos response token)
2019-04-23T14:20:37.8828830[30]info:07-0023NewClientConnection:clientinfo:clientname=AMPS_A-json-tcp-3-212422832437882870description=172.31.46.201:52502->172.31.46.201:80952019-04-23T14:20:37.8830300[15]trace:12-0010client[AMPS_A-json-tcp-3-212422832437882870]logoncommandreceived:{"c":"logon","cid":"0","client_name":"KerberosExampleClient","user_id":"60east","mt":"json","a":"processed","version":"develop.c75d0e8.256701:c++","pw":"YIICmwYJKoZIhvcSAQICAQBuggKKMIIChqADAgEFoQMCAQ6iBwMFACAAAACjggGWYYIBkjCCAY6gAwIBBaEUGxJDUkFOS1VQVEhFQU1QUy5DT02iPjA8oAMCAQOhNTAzGwRBTVBTGytpcC0xNzItMzEtNDYtMjAxLnVzLXdlc3QtMi5jb21wdXRlLmludGVybmFso4IBLzCCASugAwIBEqEDAgECooIBHQSCARkk+zZFgqOGk2kNVzI3R8MC839gvYWPUcKeNOLu2vQvHxpfT5eyW272Y6qXrttx2J4S7ccRjlwGRPxjITFGHtiGM4T7CC3DNwPieYH2qhU3pIjsDldBUqVLnNhdkwAFaj+H2gw/UIudc8DHhNAfIL8xXc3qlun/iw1zE4gsSw8NkqJewbrNLY9Q5wgpFScKGGhtmrSTelAERzp4X6Qsju5IGtVTIhzngq45sAmhiW/tqT8u5TS8mSoILYm/e8QseL24FYPwt7mueD/U4Lo27bsD4HkAMQ1OHQXPm0rp+zRz2js5A1dAQXcSLWB67016iGfto01qR+TorjKpGbM/kJX2DzfjVWiu2olcoD0CaApMQSRklN4pzoFoCqSB1jCB06ADAgESooHLBIHI1PJpEsljIQpzSi3tJHA/DIpjj25ODoOYNkbxSvHCZB22t0r+sqgxVycwnGEI8C4b8BLCp7PW8iHm0UWl2r3osNCjT8EuNFc7jAoyQIbIRRMoGH50BUzQbxGjz1th3WKzs7dlG6vOEcKXPJYGHq0hguc2lScBpXDzqw+f/wIGVdcsNGyHoY3yBXvo600pAxVaJv+jxx4X+9FbDoIUd8/l8KLXxt6ocdmMGutAec0IlO8ksUkbIOjDlaYiv9fOeoVbL1mSyOLmWTA="}2019-04-23T14:20:37.8830810[28]info:29-0103AMPSauthenticationexecutingauthenticationforuser'60east'usingKerberos2019-04-23T14:20:37.8830900[28]info:29-0103AMPSKerberosauthenticationacceptingKerberossecuritycontextwithinputtokenlengthof671bytes2019-04-23T14:20:37.8855330[28]info:29-0103AMPSKerberosauthenticationcreatingoutputtokenlengthof156bytes2019-04-23T14:20:37.8855780[28]info:29-0103AMPSKerberosauthenticationsuccessfullyprocessedsecuritycontextforuser'60east@CRANKUPTHEAMPS.COM'2019-04-23T14:20:37.8855820[28]info:29-0103AMPSKerberosauthenticationsuccessfullyauthenticateduser'60east'2019-04-23T14:20:37.8855830[28]info:29-0103AMPSauthenticationsuccessfullyauthenticateduser'60east'usingKerberos2019-04-23T14:20:37.8856330[29]info:1F-0004[AMPS_A-json-tcp-3-212422832437882870]AMPSclientsessionlogonfor:KerberosExampleClientclientsessioninfo:clientauthid='60east'clientnamehash=15396145143580885467clientversion=develop.c75d0e8.256701:c++lastackedclientseq=0lasttxlogclientseq=0correlationid=2019-04-23T14:20:37.8856600[29]trace:17-0002client[KerberosExampleClient]acksent:{"c":"ack","cid":"0","user_id":"60east","s":0,"bm":"15396145143580885467|0|","client_name":"KerberosExampleClient","a":"processed","status":"success","pw":"YIGZBgkqhkiG9xIBAgICAG+BiTCBhqADAgEFoQMCAQ+iejB4oAMCARKicQRvupwwcjivlf4T1wY+bfhi4i3qBrTnZ5toPbXyR7O3syB8WyFCA5iepf3bJ/44HRo0PKQQVSmpH1hhWtdx+T9HUWmLOiRG+lu6TCsF7RBr6pjsW+V8/iHzOTaD5/T5gxHlQIFl/nSWH8pyS/1B8EqL","version":"develop.310283.6f81d4a"}

AMPS Client Support

60East provides an implementation of an authenticator for each of the client libraries. These authenticators use the features of that individual programming language to provide the appropriate Kerberos token to AMPS.

The details of how to use each authenticator depend on the language, as described below.

Authenticating using Python

For Kerberos authentication using python there is a single module, amps_kerberos_authenticator, for authentication on both Linux and Windows.

The Python Kerberos authenticator code can be found in the amps-authentication-python github repo.

The Python Kerberos authenticator has two dependencies; the kerberos module for authentication on Linux and the winkerberos module for authentication on Windows.

In order to execute the below code the following needs to be done:

  • The USERNAME and HOSTNAME variables need to be set to the user name you are authenticating as and the fully qualified name of the host AMPS is running on.
  • Kerberos credentials need to be available for the user you are authenticating as, thus kinit needs to be executed before the code is run or the KRB5_CLIENT_KTNAME environment variable needs to be set to a keytab that has been generated for the user (note that this is for the user logging in, and should be a different keytab than the one AMPS is configured with).
importAMPSimportamps_kerberos_authenticatorUSERNAME='username'HOSTNAME='hostname'AMPS_SPN='AMPS/%s'%HOSTNAMEAMPS_URI='tcp://%s@%s:8095/amps/json'%(USERNAME,HOSTNAME)defmain():authenticator=amps_kerberos_authenticator.create(AMPS_SPN)client=AMPS.Client('KerberosExampleClient')client.connect(AMPS_URI)client.logon(5000,authenticator)

Authenticating using Java

For Kerberos authentication using Java there are two different Authenticator implmentations, one for GSSAPI based authentication and one for SSPI based authentication. GSSAPI is the only option for authentication when running on Linux, but it is supported on Windows as well. When using GSSAPI a JAAS configuration file is required. SSPI, on the other hand, uses Windows native system calls and thus is Windows only and does not require a JAAS configuration. In general, we recommend that AMPSKerberosGSSAPIAuthenticator is used when running on Linux and AMPSKerberosSSPIAuthenticator is used when running on Windows.

The Java Kerberos authenticator code can be found in the amps-authentication-java github repo.

The Java Kerberos authenticator has a number of dependencies that are detailed in the Maven POM file for the AMPSKerberos project.

Below are two different JAAS configuration options. The first example will use Kerberos credentials in the user’s Kerberos credentials cache or will prompt the user for a password to obtain the credentials. The second example utilizes a keytab to obtain the Kerberos credentials. When a JAAS configuration is utilized the java.security.auth.login.config property needs to be set to the path to the config file and the config file entry name needs to be passed to the AMPSKerberosGSSAPIAuthenticator along with the SPN.

TestClient {com.sun.security.auth.module.Krb5LoginModule requiredisInitiator=trueprincipal="username"useTicketCache=truestoreKey=true};TestClient {com.sun.security.auth.module.Krb5LoginModule requiredisInitiator=trueuseKeyTab=truekeyTab="/path/to/username.keytab"principal="username@REALM"storeKey=truedoNotPrompt=true};

In order to execute the below code the following needs to be done:

  • If using GSSAPI, create the appropriate JAAS config, uncomment the AMPSKerberosGSSAPIAuthenticator line and specify -Djava.security.auth.login.config=/path/to/jaas.conf when starting the app.
  • If running on Windows and using SSPI uncomment the AMPSKerberosSSPIAuthenticator line.
  • The username and hostname variables need to be set to the user name you are authenticating as and the fully qualified name of the host AMPS is running on.
importcom.crankuptheamps.authentication.kerberos.AMPSKerberosGSSAPIAuthenticator;importcom.crankuptheamps.authentication.kerberos.AMPSKerberosSSPIAuthenticator;importcom.crankuptheamps.client.Authenticator;importcom.crankuptheamps.client.Client;importcom.crankuptheamps.client.exception.ConnectionException;publicclassKerberosAuthExample{publicstaticvoidmain(String[]args)throwsConnectionException{Stringusername="username";Stringhostname="hostname";Stringamps_spn="AMPS/"+hostname;Stringamps_uri="tcp://"+username+"@"+hostname+":8095/amps/json";// Authenticator authenticator = new AMPSKerberosGSSAPIAuthenticator(amps_spn, "TestClient");// Authenticator authenticator = new AMPSKerberosSSPIAuthenticator(amps_spn);Clientclient=newClient("KerberosExampleClient");try{client.connect(amps_uri);client.logon(5000,authenticator);}finally{client.close();}}}

Authenticating using C++

For Kerberos authentication using C++ there are two different Authenticator implmentations, one for GSSAPI based authentication and one for SSPI based authentication. GSSAPI is the only option for authentication when running on Linux, but, unlike Java, it is not supported on Windows. Specifically, AMPSKerberosGSSAPIAuthenticator is used when running on Linux and AMPSKerberosSSPIAuthenticator is used when running on Windows.

The C++ Kerberos authenticator code can be found in the amps-authentication-cpp github repo.

The C++ Kerberos authenticator for Linux (GSSAPI) has a dependency on the GSSAPI libs that are part of the krb5 distribution.

In order to execute the below code the following needs to be done:

  • The username and hostname variables need to be set to the user name you are authenticating as and the fully qualified name of the host AMPS is running on.
#include <ampsplusplus.hpp>#include <string>#ifdef _WIN32#include "AMPSKerberosSSPIAuthenticator.hpp"#else#include "AMPSKerberosGSSAPIAuthenticator.hpp"#endifintmain(){std::stringusername("username");std::stringhostname("hostname");std::stringamps_spn=std::string("AMPS/")+hostname;std::stringamps_uri=std::string("tcp://")+username+"@"+hostname+":8095/amps/json";#ifdef _WIN32AMPS::AMPSKerberosSSPIAuthenticatorauthenticator(amps_spn);#elseAMPS::AMPSKerberosGSSAPIAuthenticatorauthenticator(amps_spn);#endifAMPS::Clientclient("KerberosExampleClient");client.connect(amps_uri);client.logon(5000,authenticator);}

Authenticating using C#/.NET

For Kerberos authentication using C# there is a single module, AMPSKerberosAuthenticator, for authentication on Windows.

The C# Kerberos authenticator code can be found in the amps-authentication-csharp github repo.

The C# Kerberos authenticator has a single dependency on the NSspi NuGet package.

In order to execute the below code the following needs to be done:

  • The username and hostname variables need to be set to the user name you are authenticating as and the fully qualified name of the host AMPS is running on.
usingAMPS.Client;usingAMPSKerberos;classKerberosAuthExample{staticvoidMain(string[]args){stringusername="username";stringhostname="hostname";stringamps_spn=string.Format("AMPS/{0}",hostname);stringamps_uri=string.Format("tcp://{0}@{1}:8095/amps/json",username,hostname);AMPSKerberosAuthenticatorauthenticator=newAMPSKerberosAuthenticator(amps_spn);using(Clientclient=newClient("KerberosExampleClient")){client.connect(amps_uri);client.logon(5000,authenticator);}}}

Server Chooser

When using a server chooser the get_authenticator function needs to be implemented and it must return the appropriate authenticator for the server you are connecting to. In the case that the server chooser is configured to return URIs for different hosts, then an authenticator configured with the correct SPN needs to be returned.

Below is an example of a server chooser implementation in python that uses multiple hosts.

importAMPSimportamps_kerberos_authenticatorfromurlparseimporturlparseUSERNAME='username'HOSTNAME1='hostname1'HOSTNAME2='hostname2'classKerberosAuthServerChooser(AMPS.DefaultServerChooser):def__init__(self):super(KerberosAuthServerChooser,self).__init__()self.authenticators={}defget_current_authenticator(self):hostname=urlparse(self.get_current_uri()).hostnameifhostnameinself.authenticators:returnself.authenticators[hostname]spn='AMPS/%s'%hostnameauthenticator=amps_kerberos_authenticator.create(spn)self.authenticators[hostname]=authenticatorreturnauthenticatordefreport_failure(self,exception,connectionInfo):printexceptiondefmain():client=AMPS.HAClient('KerberosExampleClient')chooser=KerberosAuthServerChooser()chooser.add('tcp://%s@%s:8095/amps/json'%(USERNAME,HOSTNAME1))chooser.add('tcp://%s@%s:8095/amps/json'%(USERNAME,HOSTNAME2))client.set_server_chooser(chooser)client.connect_and_logon()if__name__=='__main__':main()

Admin Interface Authentication

With an OS and browser that is properly configured for Kerberos authentication, it is possible to authenticate against the AMPS Admin Interface using Kerberos via a browser.

The curl command can also be used to authenticate against the admin interface when the OS is properly configured and curl has been built with Kerberos support.

`curl -v --negotiate -u : http://hostname:admin_port/amps/instance/config.xml`

It is also possible to programmatically authenticate with the admin interface. Below is an example using python.

#!/usr/bin/env pythonimportamps_kerberos_authenticatorimportrequestsHOSTNAME='hostname'ADMIN_PORT=0HTTP_SPN='HTTP/%s'%HOSTNAMEADMIN_URL='http://%s:%s/amps/instance/config.xml'%(HOSTNAME,ADMIN_PORT)defmain():authenticator=amps_kerberos_authenticator.create(HTTP_SPN)token=authenticator.authenticate(None,None)# No user and no return tokenr=requests.get(ADMIN_URL,headers={'Authorization':'Negotiate %s'%token})printr.text

Replication Authentication

Securing AMPS for replication requires having a replication Transport with Authentication enabled as well the use of an Authenticator in the Replication/DestinationTransport. The libamps_multi_authenticator module provides the client side authentication support for the replication connection.

The below sample AMPS configuration uses environment variables for the Kerberos configuration elements. The following variables would need to be set correctly for this config to function as expected. A second instance would also need to be configured.

  • AMPS_A_SPN - Set to AMPS/hostname where hostname is the fully qualified name of the host AMPS A is running on.
  • AMPS_B_SPN - Set to AMPS/hostname where hostname is the fully qualified name of the host AMPS B is running on.
  • AMPS_A_KEYTAB - Set to the path of a Kerberos keytab containing entries for the AMPS SPN for the A instance.
  • AMPS_USER_KEYTAB - Set to the path of a Kerberos keytab that contains an entry for the user principal that you want to use to authenticate to AMPS B.
<AMPSConfig><Name>AMPS_A</Name><Authentication><Module>libamps-multi-authentication</Module><Options><Kerberos.SPN>${AMPS_A_SPN}</Kerberos.SPN><Kerberos.Keytab>${AMPS_A_KEYTAB}</Kerberos.Keytab></Options></Authentication><Transports><!-- Authentication enabled via the top-level Authentication configuration --><Transport><Name>json-tcp</Name><InetAddr>8095</InetAddr><Type>tcp</Type><Protocol>amps</Protocol><MessageType>json</MessageType></Transport><!-- Authentication enabled via the top-level Authentication configuration --><Transport><InetAddr>8105</InetAddr><Name>amps-replication</Name><Type>amps-replication</Type></Transport></Transports><Replication><Destination><Name>AMPS_B</Name><SyncType>sync</SyncType><Transport><InetAddr>localhost:9999</InetAddr><Type>amps-replication</Type><Authenticator><Module>libamps-multi-authenticator</Module><Options><Kerberos.Keytab>${AMPS_USER_KEYTAB}</Kerberos.Keytab><Kerberos.SPN>${AMPS_B_SPN}</Kerberos.SPN></Options></Authenticator></Transport><Topic><MessageType>json</MessageType><Name>.*</Name></Topic></Destination></Replication><Modules><Module><Name>libamps-multi-authentication</Name><Library>libamps_multi_authentication.so</Library></Module><Module><Name>libamps-multi-authenticator</Name><Library>libamps_multi_authenticator.so</Library></Module></Modules>

    ...
</AMPSConfig>

To Guard and Protect

In this post, I’ve covered the basics of setting up AMPS for Kerberos authentication. If your site uses Kerberos, the team that manages that installation will have definitive answers on how Kerberos is configured in your environment.

In this post, we’ve intentionally kept the focus on AMPS. We haven’t delved into the depths of troubleshooting Kerberos installations, or the considerations involved in setting up a Kerberos infrastructure. We encourage you to work with the team responsible for your company’s Kerberos installation when configuring AMPS, since many of the most common problems in setting up Kerberos authentication are a matter of ensuring that the credentials provided match what the Kerberos server expects – which is most easily done when the owners of the Kerberos configuration are also involved.

We’re very proud to have Kerberos support available out of the box with AMPS. Let us know how the Kerberos support works for you!


Meltdown and Spectre Performance Implications

$
0
0

Spectre and Meltdown logosOver the last several days, the technology world has been focused on the impact of the Meltdown and Spectre vulnerabilities. There are several good articles published about these vulnerabilities, among them coverage from The Register and an overview from Red Hat.

In all of these discussions, there’s a common thread: the kernel fixes for these vulnerabilities will carry a performance cost. The question is – how much of a cost?

Now that some of the patches are available for Meltdown and Spectre, we’re able to provide guidance on how these patches will impact performance critical AMPS deployments. Let’s start by saying that the degradation you’ll see from these patches is highly dependent on your workload and features of AMPS you’re using.

Red Hat’s Performance Team has provided guidance on workloads and the expected performance degradation which I’m copying here for easier reference: https://access.redhat.com/articles/3307751.

In order to provide more detail, Red Hat’s performance team has categorized the performance results for Red Hat Enterprise Linux 7, (with similar behavior on Red Hat Enterprise Linux 6 and Red Hat Enterprise Linux 5), on a wide variety of benchmarks based on performance impact:

  • Measureable: 8-19% - Highly cached random memory, with buffered I/O, OLTP database workloads, and benchmarks with high kernel-to-user space transitions are impacted between 8-19%. Examples include OLTP Workloads (tpc), sysbench, pgbench, netperf (< 256 byte), and fio (random I/O to NvME).

  • Modest: 3-7% - Database analytics, Decision Support System (DSS), and Java VMs are impacted less than the “Measurable” category. These applications may have significant sequential disk or network traffic, but kernel/device drivers are able to aggregate requests to moderate level of kernel-to-user transitions. Examples include SPECjbb2005, Queries/Hour and overall analytic timing (sec).

  • Small: 2-5% - HPC (High Performance Computing) CPU-intensive workloads are affected the least with only 2-5% performance impact because jobs run mostly in user space and are scheduled using cpu-pinning or numa-control. Examples include Linpack NxN on x86 and SPECcpu2006.

  • Minimal: <2 % Linux accelerator technologies that generally bypass the kernel in favor of user direct access are the least affected, with less than 2% overhead measured. Examples tested include DPDK (VsPERF at 64 byte) and OpenOnload (STAC-N). Userspace accesses to VDSO like get-time-of-day are not impacted. We expect similar minimal impact for other offloads.

AMPS Workload Estimates

Transaction Log/Message Queues/Replication: Use cases with a Transaction Log concerned with performance are typically using a PCIe or NVMe storage device and involve significant networking, which crosses into the kernel space frequently. Our performance simulator for using AMPS within a large trading system sees just under a 12% performance degradation (both in maximum achievable throughput and increase in median latency), however this extreme simulation spends significant time in the kernel and minimal time in user mode. We expect these use cases to fall in the range between upper-end of the Modest and the lower end of the Measurable impact range of 5-12%.

Large Scale View Server Where AMPS is spending most of its time executing user mode code (SOW queries, content filtering, delta publish/subscribe, etc.) should see an impact in the Small range.

Other Considerations and Mitigation

PCID support: To minimize the impact of these patches, verify your systems have PCID enabled. Without this feature, the patches will yield a higher performance impact. You can verify your host environment has PCID support by verifying the pcid flag is reported in your /proc/cpuinfo flags row (or in your lscpu flags output if you have that command available):

$ lscpu | grep pcid

Flags:                 fpu vme de pse tsc msr pae mce cx8 apic
sep mtrr pge mca cmov pat pse36 clflush dts acpi mmx fxsr sse
sse2 ss ht tm pbe syscall nx pdpe1gb rdtscp lm constant_tsc
arch_perfmon pebs bts rep_good nopl xtopology nonstop_tsc
aperfmperf eagerfpu pni pclmulqdq dtes64 monitor ds_cpl vmx smx
est tm2 ssse3 fma cx16 xtpr pdcm pcid dca sse4_1 sse4_2 x2apic
movbe popcnt tsc_deadline_timer xsave avx f16c rdrand lahf_lm
abm epb invpcid_single spec_ctrl ibpb_support tpr_shadow vnmi
flexpriority ept vpid fsgsbase tsc_adjust bmi1 avx2 smep bmi2
erms invpcid cqm xsaveopt cqm_llc cqm_occup_llc dtherm arat pln
pts

Kernel Bypass Technologies: Using Kernel bypass technologies such as OpenOnload is a great way of minimizing the impact from these patches. If you’re already using these technologies, then your impact from these patches will be far less than those not using them.

What’s Next

We’ll keep this post updated with any new findings or suggestions. If you have any questions, please don’t hesitate writing comments below.

Easy Authentication and Entitlements

$
0
0

elegant key and keyholeOne of the most common requirements for AMPS instances is integration with an enterprise security system. In this blog post, we’ll show you the easiest way to get an integration up and running – by building an authentication and entitlement system from scratch!


In versions of AMPS prior to 5.0, the only way to integrate with an enterprise system was to create a server module to handle authentication and entitlement. AMPS version 5.0 and later include an optional module that can use a RESTful web service for authentication and entitlement. Using this module can be the easiest way to integrate into an existing system.

In this blog post, we’ll:

  1. Explain how the module works
  2. Show you how to configure AMPS to use a simple authentication web service
  3. Give you a simple sample implementation of a web service using Flask

That might sound like a lot of ground to cover, but don’t worry – this is a lot simpler than you might expect, and the Flask framework in this blog is a great starting point to use for a production-ready system, whether you’re developing a standalone service or a fully-featured integration with an existing system.

All of the code discussed here is available in a public github repository. And to give credit where credit is due, the technique for using Basic authentication with Flask is developed from a post by Armin Ronacher on the Flask snippets site.

AMPS Authentication and Entitlement

The AMPS authentication and entitlement system is designed to be straightforward.

Authentication happens when a connection logs on. The request for authentication contains a user name and a token (perhaps a password, perhaps a certificate, perhaps a single-use token).

Entitlement happens when a particular user name first requests a particular type of access to a particular resource. (For example, reading data from a particular topic by subscribing to the topic, or publishing to a particular topic.) After AMPS has checked entitlements with the module once, AMPS caches the results for future use.

So how do those steps translate to a RESTful web request?

Making it RESTful

The RESTful authentication and entitlement system does two things:

  1. Converts an AMPS logon command into an HTTP request for a permissions document, using the credentials in the logon command.
  2. Parses the permissions document and uses the permissions in that document to grant entitlements when AMPS requests an entitlement check.

That’s all there is to it.

(The full documentation for the module is in the Authentication and Entitlement using a Web Service chapter of the User Guide.)

Basics of Basic Authentication

The module supports both Basic and Digest authentication. You can read more about these in RFC7617 for Basic authentication, and RFC7616 for Digest authentication.

For this post, we’ll look at Basic authentication.

In Basic authentication, the web server (in this case, our web service) denies access to resources unless the requestor (in this case, AMPS) provides an appropriate Authorization header. If the Authorization header isn’t present, or the credentials aren’t accepted, the web server returns a 401 status with a WWW-Authenticate header that indicates that it accepts Basic authentication (and provides a token that indicates the scope of the authentication request).

It’s common for a requestor to send a request without credentials, then use the response from the server to decide what sort of authentication to use. The AMPS web service module uses this approach. When the web server indicates that it uses Basic authentication, the module returns a Authorization header with the credentials for the logon request.

GET It Done

To be able to pass credentials, the module needs to know the contents of the logon request, and the URI to use to retrieve the permissions document.

The URI is set in the module configuration (described below). The module allows you to substitute the user name of the user logging in to AMPS at any point in the URI.

To convert the logon request into an HTTP request, the module takes the user name and password and uses those to authenticate the HTTP request. The module supports both Basic and Digest authentication.

For example, AMPS receives a logon command along these lines:

{"c":"logon","cid":"1","client_name":"subscriber-AMPSGrid-Falken-host26","user_id":"falken","pw":"joshua","a":"processed","v":"5.2.1.4:java"}

The user name used for HTTP authentication will be falken, and the password used for HTTP authentication will be joshua.

If the module is configured to use http://internal-webhost:8090/{{USER_NAME}}.json as the URI, the module substitutes falken for the {{USER_NAME}} token to request /falken.json from the webserver at internal-webhost:8090.

To determine whether to use Basic or Digest authentication, the module first sends an unauthenticated request to the server. The server responds with a 401 response that contains a WWW-Authenticate header, as described above, and AMPS responds with an authenticated request along these lines:

GET /falken.json HTTP/1.0

User-Agent: AMPS HTTP Auth/1.0
Accept: */*
Authorization: Basic ZmFsa2VuOmpvc2h1YQ==

Notice that the Authorization header contains a base64-encoded representation of the username and password provided on logon.

Putting It Together: AMPS Configuration

With that background, let’s configure AMPS to use the web service module for authentication and entitlement.

First, load and configure the module:

<Module><Name>web-entitlements</Name><Library>libamps_http_entitlement.so</Library><Options><ResourceURI>http://localhost:8080/{{USER_NAME}}.json</ResourceURI></Options></Module>

Then, specify that the module is used for authentication and entitlement for the instance.

<Authentication><Module>web-entitlements</Module></Authentication><Entitlement><Module>web-entitlements</Module></Entitlement>

With this configuration, AMPS will use the web service module for authentication and entitlement for all connections to the instance, and will be looking for a service at port 8080 on the local machine.

All we need now is a web service that can use basic authentication and serve up permissions documents!

Service, Please! Coding the Web Service

While the web service module works perfectly well when requesting static documents from a web service such as Apache or nginx, for the purposes of this post, we’ll show how simple it is to use a standard HTTP application framework to build the web service.

We’ll use Flask for this sample, since it’s readily available (and we like Python!) Further, the extension points for Flask are straightforward, which makes it very handy for demonstration purposes.

To create the service, we first import the things we’ll need from Flask and define the service:

fromflaskimportFlask,request,Responsefromfunctoolsimportwraps# create the flask app exampleapp=Flask(__name__)

Next, we’ll need to define a function to return a 401 response that requests Basic authentication:

defauthenticate():"""Sends a 401 response that enables basic auth"""returnResponse('Could not verify your access level for that URL.\n''You have to login with proper credentials',401,{'WWW-Authenticate':'Basic realm="AMPS Authentication"'})

This function uses Flask to return a 401 response with an appropriate WWW-Authenticate header and a helpful message.

We also provide a function that can wrap a response: this function checks to see if the credentials provided are valid by calling a check_auth function. If so, the wrapped function is called. If not, the wrapper calls the authenticate function to return the 401 response.

defrequires_auth(f):@wraps(f)defdecorated(*args,**kwargs):auth=request.authorizationifnotauthornotcheck_auth(auth.username,auth.password):returnauthenticate()returnf(*args,**kwargs)returndecorated

This function makes it easy to validate credentials before providing a permissions document. We use wraps from the functools module to create a @requires_auth decorator for a function. What this means in practice is that, once we’ve defined this function, we can easily require successful authentication for a function by adding the @requires_auth decorator on a function.

The Flask infastructure handles decoding and parsing the Authentication header, so all we have to do is pass the values along to the check_auth function.

Now, the infrastructure is in place – all we have to do is write two functions: check_auth to verify the username and password, and a function to return a permissions document given an authenticated username.

For sample purposes, we just hard code the username and password in the authentication function:

defcheck_auth(username,password):"""This function is called to check if a username/password is valid."""returnusername=='falken'andpassword=='joshua'

Of course, in a real system, this check could do anything that it needs to, including calling out to an external system to verify the credentials.

Last, we define a function that, given an authenticated user name, returns the permissions for that user. For demonstration purposes, we just return a hard-coded JSON document. We use the wrapper defined earlier to ensure that control only enters this function if the username and password are validated by check_auth.

@app.route('/<username>.json')@requires_authdefpermission_document(username):return"""        {"logon": true,"topic": [{"topic": ".*","read": true,"write": true            }],"admin": [{"topic": "/amps/administrator/.*","read": false,"write": false            }, {"topic": ".*","read": true,"write": true             }]        }"""

This function is called for any HTTP request that matches the /<username>.json pattern. The function is only invoked after the requires_auth wrapper accepts the credentials in the request.

This permissions document grants logon access to the instance, and allows full read and write of any topic. For the admin console, the document allows access to any resource except those under the /amps/administrator path. As usual, the full syntax for the permissions document is described in the User Guide.

Last, we need to start the server when the script is loaded:

if__name__=='__main__':app.run(host='0.0.0.0',port=8080)

… and that’s it! With those few lines of configuration and code, we have a working authentication and entitlement system.

Would You Like To Play AMPS?

With AMPS configured as shown above and the simple Python script running, we can try out the authentication and entitlement system (remember, both the configuration and script are available from the github repository.)

We first start AMPS:

$ ampServer config.xml 
AMPS 5.2.1.92.210270.984c1d9 - Copyright (c) 2006-2017 60East Technologies Inc.
(Built: 2018-03-17T23:01:09Z)
For all support questions: support@crankuptheamps.com

And then start the authentication and entitlements service:

$ python auth/main.py
 * Running on http://0.0.0.0:8080/ (Press CTRL+C to quit)

Then, you can use the ping command in spark to test the credentials.

First, try with valid credentials.

$ spark ping -server falken:joshua@localhost:9007 -type json
Successfully connected to tcp://falken:*@localhost:9007/amps/json

Then, try with credentials that the authentication and entitlements service doesn’t recognize:

$ spark ping -server matthew:ferris@localhost:9007 -type json
Unable to connect to AMPS (com.crankuptheamps.client.exception.AuthenticationException: Logon failed for user "matthew").

It’s just that simple!

Where Next?

You can use this Flask framework as the foundation for a more fully-featured system by replacing the check_auth and permission_document functions. If you need to integrate with a back-end system, you can use the check_auth function to check the credentials with that system and respond accordingly. Likewise, the permission document format has been designed to be easy to construct, so you can translate whatever format your existing permissions system uses into the permissions document provided back to AMPS.

Or, if you prefer another framework for creating an HTTP server, you can use the basic pattern here to quickly implement a server in your framework of choice. It’s up to you!

What HTTP framework do you prefer, and what authentication and entitlement systems are you integrating with? Let us know!

Happy Birthday to AMPS!

$
0
0

candles with the number 10This month marks the 10 year anniversary of AMPS being deployed into production environments, helping to fuel the global financial markets. Those first customer deployments built on AMPS are still in production, and are still critical infrastructure today!

Since then, AMPS has become a key part of critical trading flow at the top financial institutions. We’ve done this thanks to our close relationships with users. With their partnership and investments into our R&D, we’ve grown AMPS to the product it is today.

The secret to our success is simple:

  • Partner with the developers using AMPS and the operations teams supporting AMPS
  • Consider the whole platform when making changes
  • Stick to our principles
  • Every engineer works with customers

We have some exciting things coming up to help take AMPS into the future. In the meantime, though, we wanted to take a minute to say THANK YOU to all of the people who have partnered with us to build their most important infrastructure on AMPS.

We couldn’t have done this without you – and the next decade will be even better!

Managing Large Topics in the SOW

$
0
0

elegant gear patternOne of the most popular features of AMPS is the State-of-the-World (or SOW), which allows applications to quickly retrieve the most current version of a message. Many applications use the SOW as a high-performance streaming database, quickly retrieving the current results of the query and then automatically receiving updates as changes occur to the data.

For maximum performance, 60East recommends making sure that all topics in the SOW (including views and conflated topics) fit into memory.

Some applications, though, require larger data sets. We’ve seen applications in production with data sets several times as large as physical memory. We’ve successfully tested SOW topics as large as 8TB on a system with 128GB of memory (a topic that is more than 60 times as large as physical memory).

AMPS version 5.2.2 introduces a new algorithm for State-of-the-World memory utilization that can greatly improve the memory efficiency and decrease the memory pressure of large SOW topics on hosts. This new algorithm applies to persistent SOW topics covered by the Transaction Log.

File-backed SOW topics that are not covered by a Transaction Log are memory mapped such that as a SOW topic grows beyond the available physical memory of the host environment, the OS will “page” the SOW topic data from memory out to the storage device and from the storage device into memory on-demand.

SOW topics covered by a Transaction Log are mapped to memory as “private” mappings which counts any modified topic memory as “anonymous dirty” data that counts towards AMPS’ Out-of-memory score (aka “OOM score”) and puts the system at increased risk of swapping.

Prior to AMPS version 5.2.2, Transaction Log covered SOW topics were left in the dirty state once modified, limiting the growth of a SOW topic to the amount of memory available to the AMPS process (typically the amount of physical memory on the host plus configured swap memory).

Starting with version 5.2.2, Transaction Log covered SOW topics are “cleansed” periodically as AMPS flushes the pages to disk manually. This “anonymous clean” data does not count towards AMPS’ OOM score and thus allows AMPS SOW topics to far exceed the memory available on the host.

Considerations for Large SOW Topics

Having SOW topics that far exceed the host memory works great for many use cases, but you must be careful, since there are many things that need to be considered:

Decreased Publish Performance: When publishing to a topic that isn’t currently resident in memory, there could be significant VM “page-outs” or “page-ins” that impede publishing performance. Capacity planning up to the host memory limit could show acceptable performance that quickly degrades once the SOW topic exceeds the size of the physical memory of the host environment.

Decreased Query Performance: When querying data where the query result contains records that are not resident, the OS pages those records into memory before the query result can be constructed and sent to the querying client. Additionally, AMPS auto-indexes fields not previously queried, so executing a query with a new field XPath in a content filter can force a re-indexing of a SOW topic, creating extensive “page-in” activity while the SOW data is brought into resident memory to be parsed and indexed.

Increased Recovery Times: When AMPS starts, it checks the CRC of every record within a SOW topic to guard against corruption. To do the CRC check, AMPS needs to bring the SOW topic into memory. If you have a 1TB SOW topic stored on a fast storage device that can read 1GB/s, it could take 17 minutes (or more) for AMPS to recover the SOW topic.

Tuning Tips

If you’re contemplating running large SOW topics that exceed the memory of your host environment, here are some tips on how to tune your host environment and configurations to get the optimal performance out of your large SOW use.

Hardware

Use Fastest Available Storage: We recommend you place the SOW topic on the fastest storage available in your environment to minimize the paging costs and recovery times. It’s expected to have increased VM paging activity when in these configurations, so the faster the storage device where these large topics are persisted, the better the performance will be. See Is Your App Solid? (Does it need SSD?) for a discussion on storage options for AMPS applications.

Operating System

Apply Recommended OS Tunings: There are OS tuning parameters that can benefit large SOW use cases, which we list here. Engage your system administration teams to set these when appropriate.

Turning off Transparent Huge Pages: Transparent Huge Pages can carry a huge cost for memory management, we recommend disabling it or setting it to “madvise”.

$ echo never > /sys/kernel/mm/transparent_hugepage/enabled

Reduce Swappiness: This setting controls the preference of dropping non-dirty pages over swapping. With large SOW files, we always want to prefer dropping rarely touched, non-dirty pages over the system swapping. Therefore, we set this value to the lowest setting without disabling it entirely.

$ sudo sysctl -w vm.swappiness=1

Increase Minimum Free Bytes: Interrupt handlers and other critical OS components require memory always being available. In large, enterprise host environments the default values controlling the minimum free for these critical operations is often not large enough. We recommend setting this value to 1% of the available memory rounded up to the nearest 1GB.

$ sudo sysctl -w vm.min_free_kbytes=2097152

Disable Zone Memory Reclaim: AMPS is already NUMA aware for it’s low-latency components and doesn’t benefit from the built-in NUMA optimizations within the Linux OS for large SOWs. We recommend turning off the Zone Memory Reclaim feature.

$ sudo sysctl -w vm.zone_reclaim_mode=0

Increase Maximum Memory Mappings: One of the thresholds set in the Linux OS configuration that can cause requests for more memory to fail prematurely is the max_map_count. When set too low, AMPS can fail to increase the size of a SOW topic. Increasing this value allows us to grow further.

$ sudo sysctl -w vm.max_map_count=500000

AMPS Configuration

Use a Large SlabSize: Using a large SlabSize for your SOW topic can minimize the overhead of memory map maintenance and rate of SOW topic file extensions when growing. We recommend using 1GB slab sizes for any of your large topics.

Use a Durability of persistent: For large topics, you want to use topics with persistent durability (the default). Using transient durability topics that are large will increase swap usage and be limited in size to the sum of the physical and swap memory on the host.

Monitoring

When AMPS version 5.2.2 or greater is running on a Linux OS with kernel version 3.14 or greater, it is recommended you monitor how much memory the host has available before swapping. This metric is exposed in the AMPS HTTP Admin in the /amps/host/memory/available path.

Testing

When testing the performance of large SOWs on runtime and recovery performance, it’s easy to be fooled by effects of the page-cache that make test results inconsistent between consecutive runs. When testing for recovery performance, we advise that you purge the page caches between AMPS lifetimes to achieve worst-case testing with your data, AMPS version, and host environment. Dropping the Linux page caches require root privileges and can be done as follows:

$ echo 1> /proc/sys/vm/drop_caches

Go Big

The AMPS State-of-the-World is suitable for large caching and computation modeling applications, for example market data caches or XVA modeling. In this post, you’ve seen the best practices and tuning recommendations 60East has developed over the course of working with many large data applications.

For any system, we highly recommend capacity planning to ensure that the resource needs of the system are well understood, and we recommend spending time carefully testing the throughput and capacity of the system. As always, if you have questions about how best to design your application or configure AMPS, let us know at support@crankuptheamps.com.

Metadata Magic with New AMPS Functions

$
0
0

magician holding a magic top hat and wandFrom the beginning, AMPS has been content aware. Most AMPS applications use content filtering, and features like the State-of-the-World, delta messaging, aggregation, and message enrichment all depend on AMPS being able to parse and filter messages.

The key to content filtering and message manipulation is the AMPS expression language. The expression language provides a format-independent way of working with content, and is extensible with server-side plugin modules.

As useful as the expression language is, up until AMPS 5.2.4.1 AMPS expressions could only refer to:

  • The contents of the message itself (using XPath-based identifiers), or
  • Context-free functions (like UNIX_TIMESTAMP())

These two types of functions are enough for working with data, but for monitoring and administration, it’s sometimes more important to be able to describe the message itself, rather than being limited to the content of the message. For example, it was difficult to filter a subscription to just publishes being submitted by a specific publisher or from a specific set of IP addresses or below a certain payload size.

Enter the client and message functions of AMPS 5.2.4.1! With these functions, you can write expressions that describe the message itself or the connection that published the message. These aren’t necessarily functions that every application needs. On the other hand, if you’ve ever tried to quickly find whether a message has been read from a SOW topic, or you want to get all the messages that a specific publisher is submitting, the new functions make magic possible!

In this post, I’ll show how to use some of these functions to answer some common requests. (Full descriptions of these functions are available in the AMPS User Guide.)

The post will focus on the following functions:

Function nameDescription
LAST_UPDATED()The last time a message in a SOW topic was published to.
MESSAGE_SIZE()The size, in bytes, of the data within a message.
REMOTE_ADDRESS()The address (typically IP address) of the connection executing the command.
USER()The authenticated user name of the user executing the command.

Finding Older Messages

One common request is to be able to find messages in a SOW topic that haven’t been updated for a certain interval of time. Before AMPS 5.4.2.1, being able to run this query would depend on adding a timestamp field to the data (typically through enrichment).

With AMPS 5.4.2.1, though, we can use the LAST_UPDATED() function to access the last time the record was updated. With the UNIX_TIMESTAMP() function, it’s simple to write a query that finds records that haven’t been updated in the last five minutes. Using the spark utility, all we have to do is provide the filter UNIX_TIMESTAMP() - LAST_UPDATED() > 300.

$ spark sow -server myserver:port -type json -topic sampleTopic \
            -filter 'UNIX_TIMESTAMP() - LAST_UPDATED() > 300'

For each message in the topic, AMPS subtracts the timestamp for the last time the message was updated from the current timestamp. If the difference is more than 300 (300 seconds, that is, five minutes), the filter is true and AMPS returns the message.

A filter like this could also be used in a sow_delete command to find and remove messages that haven’t been active in a certain interval of time.

Query Versus Subscription

Notice that for the command above, I used sow rather than subscribe or sow_and_subscribe. There’s an important reason for this: AMPS evaluates filters against a message when a sow query runs, or when there’s a change to the message. That means that a filter like UNIX_TIMESTAMP() - LAST_UPDATED() > 300 is very useful for a query, but isn’t very useful for a subscription.

Here’s why: imagine a message hasn’t been updated in 298 seconds when someone issues a sow_and_subscribe with this filter. The message doesn’t match during the sow part of the command, so it isn’t returned with the query results. After 2 more seconds, the message would match the filter. However, AMPS doesn’t re-evaluate the message against the filter until the message changes, so the subscription doesn’t receive the message. (If someone does publish to the message, that will reset the LAST_UPDATED() value, and the message would no longer match.)

Message Provenance

In some applications, it’s very important to be able to reliably identify the source of a change. In versions prior to 5.2.4.1, the most commonly used pattern was to require each publisher to annotate changes with the user name of the person making the change, while using an entitlement filter to guarantee that the annotations matched the expected user name.

With 5.2.4.1, you can use the USER() function with enrichment to have AMPS directly annotate each change. This makes things simpler for publishers, and can also provide information that was not previously verifiable.

For example, the following simple topic annotates each publish with the authenticated user name of the connection submitting the publish and captures the address from which the publish originated.

<SOW><Topic><Name>change-source-sample</Name><MessageType>json</MessageType><FileName>./sow/%n.sow</FileName><Key>/id</Key><Enrichment><Field>CONCAT(USER(), ' connected from ',
                       REMOTE_ADDRESS())
                AS /lastChangedBy</Field></Enrichment></Topic></SOW>

Since enrichment modifies the message before the message is written to the transaction log, the enrichment is also captured in the transaction log for an embedded audit trail.

Calculating Message Size Statistics

An important factor in capacity planning is understanding message sizes. Estimates before a system goes into production are helpful, but as a system comes online, more precise data is available and can be used to validate (or correct) the initial estimates. Likewise, for views, it can be inconvenient to persist the contents of the view to be able to estimate averages.

With the MESSAGE_SIZE() function and aggregated subscriptions, it’s easy to calculate metrics over a topic in the state of the world.

For example, the following spark query computes basic message size metrics for a SOW topic or view:

spark sow -topic test -server localhost:9007/amps/json -opts \'projection=[sum(message_size()) as /totalSize,\             max(message_size()) as /biggestMessage,\             avg(message_size()) as /averageSize,\             stddev_samp(message_size()) as /stdDev],\ grouping=[/nullValue]'

Notice that, since we want to calculate a single value for the entire topic, the spark command deliberately sets grouping to a field that isn’t in the messages. The result is that all the messages in the topic are in the same group, and the metrics are computed over the entire topic.

Data Up Your Sleeve

Just as every good magic trick relies on skill and knowledge, using the new metadata functions well also requires some understanding of how AMPS works and what functions are available when.

The simple rule to follow is that a metadata function returns meaningful results if AMPS has the information to provide, and NULL otherwise.

For example, AMPS can only provide a LAST_UPDATED() value for messages that are in the State of the World. If there’s no State of the World (that is – AMPS isn’t persisting messages in a way that they can be queried), then there’s no way for AMPS to calculate LAST_UPDATED(). Likewise, since AMPS only assigns bookmarks to messages that are stored in the transaction log, the BOOKMARK() function only returns a value for that function for topics that are stored in the transaction log.

The AMPS User Guide lists the circumstances under which each of the functions returns a non-NULL value.

Tricks of the Trade

In this post, we’ve just scratched the surface of the functions available and the ways that those functions can be used.

Have a recipe that isn’t listed here? Know a great trick for monitoring AMPS with these functions, or have a cool technique that isn’t mentioned here? How will you use the new functions?

Let us know in the comments!

Monitor your AMPS instances with Prometheus and Grafana

$
0
0

a light bulb with Earth as a light source

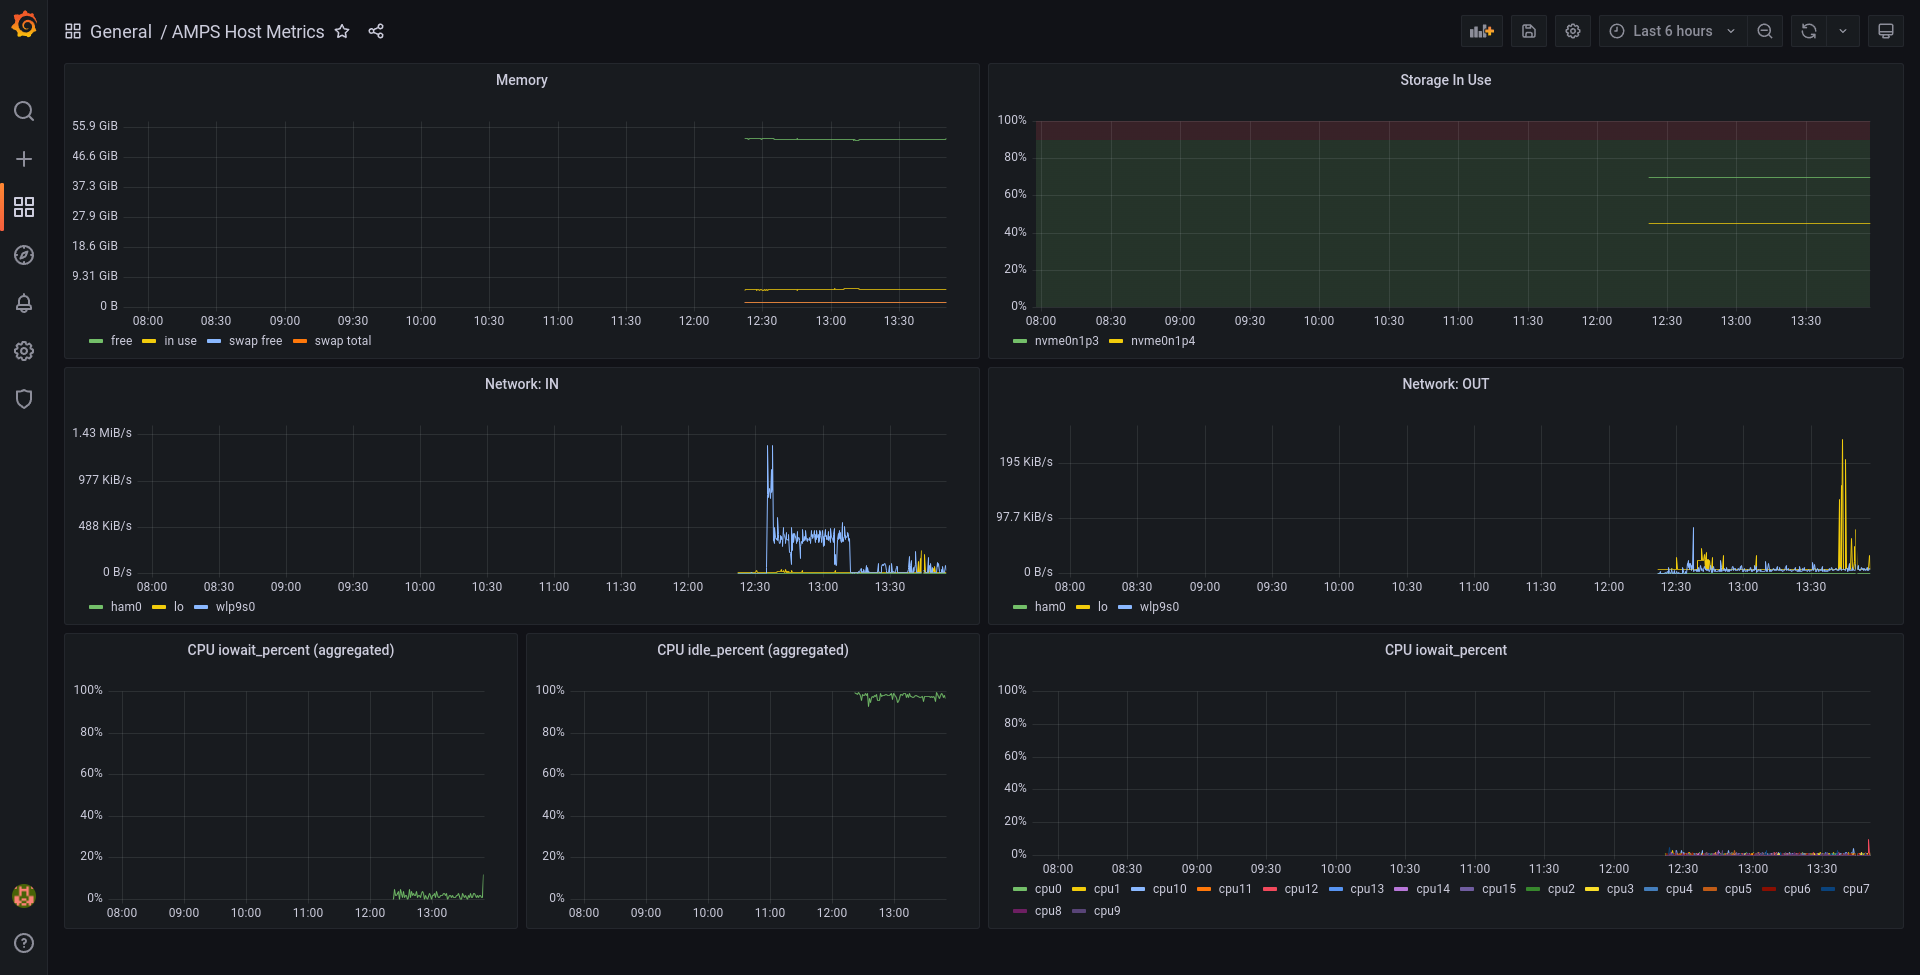
Modern data processing systems are complex and often consist of several sub-systems from various vendors where each individual subsystem typically exposes some sort of monitoring interface with its own metrics, format, authentication and access control. In order to keep such complexity under control and be able to monitor whole system state in real-time and in the past, standard monitoring packages have emerged. These days, most customers we work with use off-the-shelf monitoring software rather than building monitoring systems from the ground up.

One popular package is Prometheus. Prometheus is an open-source product created to collect and aggregate monitoring data and stats from different systems in a single place. Prometheus conveniently integrates with Grafana, another open source tool that can visualize and present monitoring stats organized in dashboards. In this post, I’m going to demonstrate how to integrate the built-in AMPS Admin API with Prometheus, and thus, with Grafana in order to monitor and visualize various AMPS metrics.

To make this demo work, we’re going to need to do a few things:

  • configure AMPS Admin API
  • create a data exporter that exposes data from AMPS Admin API in a format recognized by Prometheus
  • configure Prometheus to use the AMPS data exporter
  • configure Grafana to use Prometheus as a data source

As usual, all of the files used in this article are available on Github.

If you’ve never worked with Prometheus or Grafana before, you can find detailed quick start guides here:

Configure AMPS Admin API

AMPS has a built-in Admin module that provides metrics using a RESTful interface. All it takes to enable the monitoring and statistics interface is to add the Admin section in the AMPS configuration file:

<AMPSConfig>
    ...

    <Admin><InetAddr>8085</InetAddr><FileName>stats.db</FileName><Interval>1s</Interval></Admin>

    ...
</AMPSConfig>

If your configuration already has the Admin API enabled, just take note of the port number used for the Admin API.

Otherwise, you can simply add the Admin section that exposes the Admin API at the specified URL (http://localhost:8085) and also stores stats in a file (stats.db)

Once you’ve prepared the configuration file, start AMPS. The full configuration file for the demo is available on Github for your convenience.

The detailed description of every metric AMPS provides is available in the Monitoring guide here.

Create an AMPS data exporter for Prometheus

In order to add AMPS monitoring stats to Prometheus we will need a custom exporter. Exporters are applications that convert monitoring data into a format recognized by Prometheus. The detailed guide on how to write Exporters is available here. Depending on the language you want to use you might utilize one of the official client libraries available here. In our demo, we will be using Python since Python is simple to use and allows us to focus on the exporter’s logic. As with the configuration file, all the files mentioned in this section are in github.

Now we’ll need to create the exporter application that you can run as a python app.

First, make sure you’ve installed the dependencies for the Prometheus client:

pip install requests prometheus_client

Our exporter will need a custom collector – a special class that collects data from AMPS upon receiving a scrape event from Prometheus:

fromprometheus_client.coreimportGaugeMetricFamilyimportrequestsclassAMPSCollector(object):defget_stats(self):"""    This method collects stats from AMPS at the moment     of the scrape event from Prometheus. It can also     handle all the required authentication / custom HTTP     headers, if needed."""returnrequests.get('http://localhost:8085/amps.json').json()defcollect(self):# load currents stats from AMPS firststats=self.get_stats()# update the metrics -- add# whichever metrics you need to# monitor here.yieldGaugeMetricFamily('amps_instance_clients','Number of currently connected clients',value=len(stats['amps']['instance']['clients']))yieldGaugeMetricFamily('amps_instance_subscriptions','Number of currently active subscriptions',value=len(stats['amps']['instance']['subscriptions']))yieldGaugeMetricFamily('amps_host_memory_in_use','The amount of memory currently in use.',value=stats['amps']['host']['memory']['in_use'])# The repository has more metrics with more# advanced collection -- check it out!

To add an exposed metric, we use a GaugeMetricFamily object. For example in the above sample we expose the metric amps_instance_clients that corresponds with the number of Client objects reported in the Admin API at the /amps/instance/clients path.

Most AMPS metrics can use the gauge metric type since it’s a simple value that can be set at each interval. You can read more about Prometheus metrics types here.

The collector class only has a single required method – collect(). The collect() method is called upon a scrape event. Once called, the method is responsible for populating metrics values which are gathered from AMPS via a simple GET request to the AMPS Admin API. We request data in the JSON format by adding .json at the end of URL since JSON is easily convertible into native Python lists and dictionaries.

Second, we need to register our AMPS collector within the Prometheus client:

fromprometheus_client.coreimportREGISTRYREGISTRY.register(AMPSCollector())

Finally, we start the HTTP server supplied by the client that will be serving exporter’s data to Prometheus:

fromprometheus_clientimportstart_http_serverimporttimeif__name__=='__main__':# Start up the server to expose the metrics.start_http_server(8000)# keep the server runningwhileTrue:time.sleep(10)

The above code uses a custom collector to properly request data from AMPS and expose it to Prometheus at the moment of a scrape event. Depending on the policies at your site, you might modify the get_stats() method to add authentication / entitlement handling, if needed. More information about securing AMPS Admin API is available here.

Start the exporter application and it will expose an HTTP interface at localhost:8000 for Prometheus to scrape:

python amps-exporter.py

That’s it: our custom exporter is complete!

For more details on the Prometheus Python client, see the manual, available here.

Configure Prometheus to use the AMPS data Exporter

Now we need to configure Prometheus to utilize the new scrape target (that is, the service provided by the exporter) that we just created. To do this, add a new job to the configuration file:

global:# Set the scrape interval to every 10 seconds. # Default is every 1 minute.scrape_interval:10sscrape_configs:-job_name:'amps_stats'# Override the global default # and scrape targets to every 1 seconds. # (should match AMPS > Admin > Interval settings)scrape_interval:1sstatic_configs:-targets:['localhost:8000']labels:group:'AMPS'

In the above example, we add the job and also override the scrape_interval value to match the AMPS Admin statistics interval value we set in the first step. Since that’s the interval at which AMPS refreshes statistics, it’s not necessarily useful for Prometheus to ask for statistics on a different interval.

I’ve set the scrape_interval at the job level since several AMPS instances can be monitored, and each instance might have a different statistics interval.

Once configured, Prometheus can be started with this configuration file:

./prometheus --config.file=prometheus.yml

That’s all it takes to start collecting AMPS statistics into Prometheus!

Configure Grafana to use Prometheus as a data source

Of course, statistics are more useful if there’s a way to visualize them. That’s where Grafana comes in.

Once the data is in Prometheus, adding it to Grafana is straightforward. Navigate to Grafana and add Prometheus as a Data Source. The detailed instructions on how to do this are available here.

The only setting you’ll need to modify for our example is the URL: http://localhost:9090. After the data source is added, building the dashboard is pretty straightforward – you can choose different graphs, thresholds and re-arrange widgets on the page. Here’s the dashboard I built:

AMPS Grafana Dashboard

To Infinity and Beyond!

In this post, we’ve just scratched the surface of how AMPS Admin API can be integrated with Prometheus and Grafana. Many metrics are available and there are a wide variety of ways those metrics can be visualized. Since Prometheus can collect data from a wide variety of sources, you can also combine data on the AMPS instance with data about other parts of the application, giving you full end-to-end monitoring.

For further reading, here are some more articles about AMPS monitoring:

Have a recipe that isn’t listed here? Know a great trick for monitoring AMPS with Prometheus, or have a cool technique that isn’t mentioned here? What dashboard would you build? What other systems would you monitor together with AMPS?

Let us know in the comments!

AMPS 5.3: More Power, More Performance

$
0
0

lightning strike in a dark night 60East is proud to announce the release of AMPS 5.3 — the most fully-featured and easy to use version of AMPS yet!

Production Tested From Day One

The 5.3 release marks the full release of the features we’ve been releasing in previews for the last 18 months. The preview program was designed to quickly provide access to new features, and one measure of the success of the preview program is that most of the new features in this release have already been used in production for months, at multiple customer sites, making this the most well-vetted version of AMPS in our history.

Advanced Features for Demanding Applications

This release includes the following major features, new since 5.2:

  • Select lists, which allow a subscriber to receive a precise subset of the fields in a message, rather than having to receive the full message.
  • Priority queues, which provide the ability to deliver more important messages first, rather than providing messages in strict first-in-first-out order.
  • Full support for paginated sow_and_subscribe. With this support, a client can specify a page of messages to monitor, and receive only updates for messages in that page. This feature includes support for providing an oof message when messages leave the window.
  • Dramatically expanded set of functions for use in filters, preprocessing/enrichment, and view construction. These new functions include access to metadata for the message and the connection from which the message originated, when available.
  • Improved support for dead letter queues and poison message handling in AMPS queues
  • Performance enhancements throughout the server, including significant enhancements to bookmark replay scalability and the ability of AMPS to handle SOW topics recorded in the transaction log that are much larger than physical memory.
  • Configurable conflation intervals for acknowledgement messages. This allows applications that cannot tolerate the 1 second conflation interval to decrease the wait for acknowledgements to be returned to a publisher.
  • An optional authentication module that can use an existing Kerberos or LDAP system to verify the identity of a connection to AMPS.
  • Support for Protocol Buffers v3
  • Support for MessagePack
  • Support for unsigned long integers
  • Major improvements to the Admin console, including new statistics, new views in Galvanometer, and a new “dark” theme.
  • Support for Basic Authentication in the Admin console
  • Support for HTTPS in the Admin console

We’ll be following up with more extensive blog posts on many of these features in the weeks to come.

Aside from these major improvements, this release includes dozens of smaller improvements and bug fixes. See the release history for the full list.

Upgrade In Seconds

We’re also excited about a few things that aren’t in this release. In the 5.3 release, you can upgrade your AMPS instances from 5.0 or 5.2 without running the amps_upgrade tool to process data files. AMPS 5.3 will work seamlessly with data files from a previous version. (Notice, though, that 5.3 may record data that cannot be processed by earlier versions, so while upgrade is seamless, earlier versions of AMPS do not work with the new features in 5.3 and do not support rollback).

You can also replicate between 5.2 versions of AMPS and 5.3 for the purposes of rolling and incremental upgrades. This capability is intended to help distributed teams and applications with complex topologies upgrade “in place” without the need for a service to ever completely go offline.

All of this means that an upgrade can often be as simple as stopping the running version of AMPS and restarting with the new binary. (60East recommends testing the upgrade in a development or test environment first, of course, since we’ve also added more error-prevention to the startup process.)

Cranked Up and Ready

AMPS 5.3 is available for download and ready to take on your most demanding workloads. What’s your favorite part of AMPS 5.3? Let us know – whether that’s one of the major features mentioned above, a smaller improvement, the new theme in Galvanometer, or something else entirely!

[Updated 5/20/2019 to mention unsigned long support.]


Select Lists: Data Served Up As You Like It

$
0
0

burrito loaded with ingredientsSelect Lists is a new feature introduced in our 5.3 release of the AMPS server. This feature lets you declare a subset of fields for your application to receive when querying or subscribing to a topic. AMPS client applications no longer need to receive a full message when the application will only use part of the message. This feature, when combined with existing filter functionality, provides developers with new methods to efficiently manage the volume of data flowing back to their applications from the AMPS server.

Select lists can be used to replace prior work-arounds such as declaring views on top of underlying topics, simply to provide a method to project a subset of fields from the underlying messages, back to the client application. Likewise, if an application declares an aggregated subscription only for the sake of receiving a subset of fields, select lists is an easier and more efficient way to get the same result.

Choose Your Fields

Select lists introduces a new, expressive grammar to declare which fields an application would like to receive from AMPS.

The grammar used to declare a Select List specifies a new options keyword, select= followed by a comma-delimited list of XPath identifiers for fields that you wish to grant or remove access to. You express whether you are granting or removing access by prepending a + or - immediately preceding the XPath identifiers. Examples of each of these tokens are +/included and -/excluded for requesting that AMPS include the /included field and requesting that AMPS exclude the -/excluded field, respectively. For additional details, please refer to the AMPS User Guide.

Building A Better Burrito

Let’s look at a simple example. Suppose a message lists the ingredients of a burrito.

{"id":123,"menu_item":"basic burrito","green":"lettuce","protein":"chicken","beans":"pinto","cheese":"cheddar mix","topping":"sour cream","salsa":"chipotle","tortilla":"flour"}

An application that wanted to know the full ingredients of the burrito could simply do a sow query for a burrito, as follows:

# Assume diner is a connected AMPS Client or HAClientformindiner.sow('foods','/menu_item = "basic burrito"'):printm.get_data()

This would return the original message.

An application could use a select list, though, to simply see what protein and salsa is available on a basic burrito:

# Assume diner is a connected AMPS Client or HAClientformindiner.sow('foods','/menu_item = "basic burrito"',options='select=[-/,+/protein,+/salsa]'):printm.get_data()

This query explicitly removes all fields from the message with the directive -/, then adds back the protein and salsa fields. This select list produces the following result:

{"protein":"chicken","salsa":"chipotle"}

Notice that the message contains exactly the fields requested in the select list. No other information is included – not even the key field for the SOW or the field that the query filters on.

Following this pattern, you could also easily select other versions of the basic burrito. For example, you could make a vegan burrito:

# Assume diner is a connected AMPS Client or HAClient# Vegan burritoformindiner.sow('foods','/menu_item = "basic burrito"',options='select=[-/protein,-/cheese,-/topping]'):printm.get_data()
{"id":123,"menu_item":"basic burrito","green":"lettuce","beans":"pinto","salsa":"chipotle","tortilla":"flour"}

You could also select a burrito without any beans or tortilla:

# Assume diner is a connected AMPS Client or HAClient# Low carb burritoformindiner.sow('foods','/menu_item = "basic burrito"',options='select=[-/beans,-/tortilla]'):printm.get_data()

Keeping Result Sets Lean

Dashboard client applications are a perfect fit to use Select Lists in concert with paginated subscriptions, to optimize as responsive a UI as possible!

The following example highlights how a dashboard client application would query a quotes topic using a paginated sow_and_subscribe command to request 10 messages at a time and dynamically selecting the subset of fields it would like to receive. Before select lists, AMPS would either require the user to receive all fields from the topic (possibly many more than required), create a View that would project the desired subset of fields to be returned, or use dynamic aggregation (which created and calculated an aggregation, even when the only result was to provide a few fields.

For example, the dashboard might simply return the ticker, price and quantity fields while retrieving 10 messages at a time:

# Assumes dashboard is a connect AMPS Client or HAClientdashboard.sow_and_subscribe('quotes',order_by='/ticker', \
          options='top_n=10,skip_n=10,select=[-/,+/ticker,+/price,+/qty]')

Securing Data with Select Lists

Select Lists have been built-in to all aspects of AMPS. Not only are subscribing clients able to specify a Select List for fields to be returned, but AMPS also provides select lists as part of the entitlement system. These select lists can be use to prevent users from retrieving or querying certain fields within a topic.

Below are some example Entitlement Select Lists that to demonstrate how they would be declared:

{"userId":456,"userName":"John Investor","password":"NeverGonnaGuess","secret":"Boston Red Sox fan","optional":"empty"}

In this example, the Entitlement Select List starts off by implicitly granting full access to all fields (explicitly, would specify +/) then specifying the removal of access to the /password and /secret expressions for those specific fields.

-/password,-/secret

For the message above, the result would be that the user would be able to see the userId, userName, and optional fields. Even better, if the user provides a filter that provides either the password field or the secret field, those fields will always be treated as NULL– exactly the same as if they did not exist in the original message.

Another way to use entitlement select lists is to configure an explicit removal of access to all fields, followed by granting of individual entitlement to specific fields. This expression would grant entitlement to the following fields: userId and userName.

-/,+/userId,+/userName

In this case, no matter what other fields were present in the message, this user would only be able to see the userId and userName fields. For that user, it is as though no other fields exist.

Choose Your Own Data (or Toppings)

As shown above, select lists are one more feature to help applications reduce bandwidth usage and processor consumption. Just like ordering a burrito, you can add or remove data as your application needs. Of course, also like ordering a burrito, you can only choose from the data available – you can’t order mango salsa if there’s no mango salsa available. So, for a basic burrito, you can include or remove an ingredient, but you can’t change the value of an ingredient. (If you do need to change data in a message, you can use a view, an aggregated subscription, or enrichment/preprocessing to do that, depending on your exact needs.)

With the integration into the entitlement system, select lists also provide another facet of an overall strategy for keeping data secure in AMPS. Combined with entitlement filters and the extensibility of AMPS user-defined functions, AMPS has extremely fine-grained control over access to data.

How do you plan to use select lists? How much bandwidth and processing power will you save? Let us know in the comments!

[Edited on 5/23/2019 to fix typos in text and code snippets.]

Secure your AMPS instances with Kerberos

$
0
0

kerberosKerberos has been an industry standard for authentication for many years and, as of 5.3, AMPS now ships with Kerberos support. AMPS Kerberos support is provided as one of the authentication mechanism options available via the libamps_multi_authentication module. Kerberos requires that an authentication token be generated and set by the client, so there are also client-side Kerberos authenticators implemented for each of the AMPS client libraries.

Before going any further, it’s important to note that for this post (and to use Kerberos in your environment), Kerberos infrastructure is a prerequisite. Setting up Kerberos infrastructure is beyond the scope of this article, and is something that is normally managed by a dedicated team.

Assuming that Kerberos is already set up for your environment, you will need the following for this demo to function:

  • 2 Kerberos Service Principle Names (SPNs)
    • HTTP/hostname - For securing the AMPS Admin Interface (hostname must be the fully qualified host name where your AMPS instance is running)
    • AMPS/hostname - For securing the AMPS Transports
  • A Kerberos Keytab containing the above SPNs
  • A user with Kerberos credentials (may be obtained via kinit, via a Keytab for the user or automatically during logon which is often the case for Windows/Active Directory). Note that for configuring Replication Authentication a Keytab for the user that the AMPS server will authenticate as is required.

Configuring AMPS

As documented in the Configuration Guide the Authentication element can be specifed for the instance as a whole and/or for each Transport. In the below configuration Kerberos authentication has been enabled for all transports using the AMPS SPN and then overridden for the Admin interface to use the HTTP SPN. Note that in addition to the Authentication element, libamps_multi_authentication.so must be specified as a Module in the Modules section as it is not loaded into AMPS by default.

The below AMPS configuration uses environment variables for the Kerberos configuration elements, thus before starting AMPS using this config the following variables need to be set:

  • AMPS_SPN - Set to AMPS/hostname where hostname is the fully qualified name of the host AMPS is running on.
  • HTTP_SPN - Set to HTTP/hostname where hostname is the fully qualified name of the host AMPS is running on.
  • AMPS_KEYTAB - Set to the path of a Kerberos keytab containing entries for the AMPS and HTTP SPNs.
<AMPSConfig>
    ...
    <Authentication><Module>libamps-multi-authentication</Module><Options><Kerberos.SPN>${AMPS_SPN}</Kerberos.SPN><Kerberos.Keytab>${AMPS_KEYTAB}</Kerberos.Keytab></Options></Authentication><Admin><InetAddr>8085</InetAddr><FileName>stats.db</FileName><Authentication><Module>libamps-multi-authentication</Module><Options><Kerberos.SPN>${HTTP_SPN}</Kerberos.SPN><Kerberos.Keytab>${AMPS_KEYTAB}</Kerberos.Keytab></Options></Authentication></Admin><Transports><!-- Authentication enabled via the top-level Authentication configuration --><Transport><Name>json-tcp</Name><InetAddr>8095</InetAddr><Type>tcp</Type><Protocol>amps</Protocol><MessageType>json</MessageType></Transport></Transports><Modules><Module><Name>libamps-multi-authentication</Name><Library>libamps_multi_authentication.so</Library></Module></Modules>
    ...
</AMPSConfig>

Success!

When AMPS starts up the following will be written to the AMPS log.

2019-04-23T13:51:11.2302690[1]info:29-0103AMPSauthenticationcreatingauthenticationcontextfortransport'amps-admin'2019-04-23T13:51:11.2302900[1]info:29-0103AMPSKerberosauthenticationenabledwiththefollowingoptions:[Kerberos.Keytab=/home/bamboo/blog/instance/HTTP-linux-ip-172-31-46-201.us-west-2.compute.internal.keytab][Kerberos.SPN=HTTP/ip-172-31-46-201.us-west-2.compute.internal]2019-04-23T13:51:11.2303670[1]info:29-0103AMPSKerberosauthenticationimportingservicename'HTTP@ip-172-31-46-201.us-west-2.compute.internal'2019-04-23T13:51:11.2303720[1]info:29-0103AMPSKerberosauthenticationacquiringcredentialsforservicename'HTTP@ip-172-31-46-201.us-west-2.compute.internal'2019-04-23T13:51:11.2564880[1]info:29-0103AMPSauthenticationcontextcreatedsuccessfully2019-04-23T13:51:11.2564950[1]info:29-0103AMPSauthenticationcreatingauthenticationcontextfortransport'json-tcp'2019-04-23T13:51:11.2565040[1]info:29-0103AMPSKerberosauthenticationenabledwiththefollowingoptions:[Kerberos.Keytab=/home/bamboo/blog/instance/AMPS-linux-ip-172-31-46-201.us-west-2.compute.internal.keytab][Kerberos.SPN=AMPS/ip-172-31-46-201.us-west-2.compute.internal]2019-04-23T13:51:11.2565270[1]info:29-0103AMPSKerberosauthenticationimportingservicename'AMPS@ip-172-31-46-201.us-west-2.compute.internal'2019-04-23T13:51:11.2565280[1]info:29-0103AMPSKerberosauthenticationacquiringcredentialsforservicename'AMPS@ip-172-31-46-201.us-west-2.compute.internal'2019-04-23T13:51:11.2609840[1]info:29-0103AMPSauthenticationcontextcreatedsuccessfully

Below is the logging for a successful authentication. In this log snippet we can see the following:

  • Client connection
  • Client logon (with the password field set to the base64 encoded kerberos token)
  • Logging related to the authentication process including success messages
  • Client session info
  • Logon response (with the password field set to the base64 encoded kerberos response token)
2019-04-23T14:20:37.8828830[30]info:07-0023NewClientConnection:clientinfo:clientname=AMPS_A-json-tcp-3-212422832437882870description=172.31.46.201:52502->172.31.46.201:80952019-04-23T14:20:37.8830300[15]trace:12-0010client[AMPS_A-json-tcp-3-212422832437882870]logoncommandreceived:{"c":"logon","cid":"0","client_name":"KerberosExampleClient","user_id":"60east","mt":"json","a":"processed","version":"develop.c75d0e8.256701:c++","pw":"YIICmwYJKoZIhvcSAQICAQBuggKKMIIChqADAgEFoQMCAQ6iBwMFACAAAACjggGWYYIBkjCCAY6gAwIBBaEUGxJDUkFOS1VQVEhFQU1QUy5DT02iPjA8oAMCAQOhNTAzGwRBTVBTGytpcC0xNzItMzEtNDYtMjAxLnVzLXdlc3QtMi5jb21wdXRlLmludGVybmFso4IBLzCCASugAwIBEqEDAgECooIBHQSCARkk+zZFgqOGk2kNVzI3R8MC839gvYWPUcKeNOLu2vQvHxpfT5eyW272Y6qXrttx2J4S7ccRjlwGRPxjITFGHtiGM4T7CC3DNwPieYH2qhU3pIjsDldBUqVLnNhdkwAFaj+H2gw/UIudc8DHhNAfIL8xXc3qlun/iw1zE4gsSw8NkqJewbrNLY9Q5wgpFScKGGhtmrSTelAERzp4X6Qsju5IGtVTIhzngq45sAmhiW/tqT8u5TS8mSoILYm/e8QseL24FYPwt7mueD/U4Lo27bsD4HkAMQ1OHQXPm0rp+zRz2js5A1dAQXcSLWB67016iGfto01qR+TorjKpGbM/kJX2DzfjVWiu2olcoD0CaApMQSRklN4pzoFoCqSB1jCB06ADAgESooHLBIHI1PJpEsljIQpzSi3tJHA/DIpjj25ODoOYNkbxSvHCZB22t0r+sqgxVycwnGEI8C4b8BLCp7PW8iHm0UWl2r3osNCjT8EuNFc7jAoyQIbIRRMoGH50BUzQbxGjz1th3WKzs7dlG6vOEcKXPJYGHq0hguc2lScBpXDzqw+f/wIGVdcsNGyHoY3yBXvo600pAxVaJv+jxx4X+9FbDoIUd8/l8KLXxt6ocdmMGutAec0IlO8ksUkbIOjDlaYiv9fOeoVbL1mSyOLmWTA="}2019-04-23T14:20:37.8830810[28]info:29-0103AMPSauthenticationexecutingauthenticationforuser'60east'usingKerberos2019-04-23T14:20:37.8830900[28]info:29-0103AMPSKerberosauthenticationacceptingKerberossecuritycontextwithinputtokenlengthof671bytes2019-04-23T14:20:37.8855330[28]info:29-0103AMPSKerberosauthenticationcreatingoutputtokenlengthof156bytes2019-04-23T14:20:37.8855780[28]info:29-0103AMPSKerberosauthenticationsuccessfullyprocessedsecuritycontextforuser'60east@CRANKUPTHEAMPS.COM'2019-04-23T14:20:37.8855820[28]info:29-0103AMPSKerberosauthenticationsuccessfullyauthenticateduser'60east'2019-04-23T14:20:37.8855830[28]info:29-0103AMPSauthenticationsuccessfullyauthenticateduser'60east'usingKerberos2019-04-23T14:20:37.8856330[29]info:1F-0004[AMPS_A-json-tcp-3-212422832437882870]AMPSclientsessionlogonfor:KerberosExampleClientclientsessioninfo:clientauthid='60east'clientnamehash=15396145143580885467clientversion=develop.c75d0e8.256701:c++lastackedclientseq=0lasttxlogclientseq=0correlationid=2019-04-23T14:20:37.8856600[29]trace:17-0002client[KerberosExampleClient]acksent:{"c":"ack","cid":"0","user_id":"60east","s":0,"bm":"15396145143580885467|0|","client_name":"KerberosExampleClient","a":"processed","status":"success","pw":"YIGZBgkqhkiG9xIBAgICAG+BiTCBhqADAgEFoQMCAQ+iejB4oAMCARKicQRvupwwcjivlf4T1wY+bfhi4i3qBrTnZ5toPbXyR7O3syB8WyFCA5iepf3bJ/44HRo0PKQQVSmpH1hhWtdx+T9HUWmLOiRG+lu6TCsF7RBr6pjsW+V8/iHzOTaD5/T5gxHlQIFl/nSWH8pyS/1B8EqL","version":"develop.310283.6f81d4a"}

AMPS Client Support

60East provides an implementation of an authenticator for each of the client libraries. These authenticators use the features of that individual programming language to provide the appropriate Kerberos token to AMPS.

The details of how to use each authenticator depend on the language, as described below.

Authenticating using Python

For Kerberos authentication using python there is a single module, amps_kerberos_authenticator, for authentication on both Linux and Windows.

The Python Kerberos authenticator code can be found in the amps-authentication-python github repo.

The Python Kerberos authenticator has two dependencies; the kerberos module for authentication on Linux and the winkerberos module for authentication on Windows.

In order to execute the below code the following needs to be done:

  • The USERNAME and HOSTNAME variables need to be set to the user name you are authenticating as and the fully qualified name of the host AMPS is running on.
  • Kerberos credentials need to be available for the user you are authenticating as, thus kinit needs to be executed before the code is run or the KRB5_CLIENT_KTNAME environment variable needs to be set to a keytab that has been generated for the user (note that this is for the user logging in, and should be a different keytab than the one AMPS is configured with).
importAMPSimportamps_kerberos_authenticatorUSERNAME='username'HOSTNAME='hostname'AMPS_SPN='AMPS/%s'%HOSTNAMEAMPS_URI='tcp://%s@%s:8095/amps/json'%(USERNAME,HOSTNAME)defmain():authenticator=amps_kerberos_authenticator.create(AMPS_SPN)client=AMPS.Client('KerberosExampleClient')client.connect(AMPS_URI)client.logon(5000,authenticator)

Authenticating using JavaScript (Node.js)

While Kerberos works automatically through the Negotiate mechanism of every browser, server-side Node.js applications might require some extra steps to make the Kerberos authentication work with the JavaScript client.

For Kerberos authentication using JavaScript there is a single package, amps-kerberos-authenticator, available in NPM, for authentication on both Linux and Windows.

The JavaScript Kerberos authenticator code can be found in the amps-authentication-javascript github repo.

The JavaScript Kerberos authenticator has two dependencies; the kerberos package and the amps package. Both are available in NPM and will be installed automatically if the authenticator is installed from NPM:

npm install --save amps-kerberos-authenticator

In order to execute the below code the following needs to be done:

  • The USERNAME and HOSTNAME variables need to be set to the user name you are authenticating as and the fully qualified name of the host AMPS is running on.
  • Kerberos credentials need to be available for the user you are authenticating as, thus kinit needs to be executed before the code is run or the KRB5_CLIENT_KTNAME environment variable needs to be set to a keytab that has been generated for the user (note that this is for the user logging in, and should be a different keytab than the one AMPS is configured with).
const{Client}=require('amps');const{AMPSKerberosAuthenticator}=require('amps-kerberos-authenticator');asyncfunctionmain(){constUSERNAME='username';constHOSTNAME='hostname';constAMPS_SPN='AMPS/'+HOSTNAME;constAMPS_URI='ws://'+USERNAME+'@'+HOSTNAME+':8095/amps/json';constauth=newAMPSKerberosAuthenticator(AMPS_SPN);constclient=newClient('KerberosExampleClient');awaitclient.connect(AMPS_URI,auth);}main();

Authenticating using Java

For Kerberos authentication using Java there are two different Authenticator implmentations, one for GSSAPI based authentication and one for SSPI based authentication. GSSAPI is the only option for authentication when running on Linux, but it is supported on Windows as well. When using GSSAPI a JAAS configuration file is required. SSPI, on the other hand, uses Windows native system calls and thus is Windows only and does not require a JAAS configuration. In general, we recommend that AMPSKerberosGSSAPIAuthenticator is used when running on Linux and AMPSKerberosSSPIAuthenticator is used when running on Windows.

The Java Kerberos authenticator code can be found in the amps-authentication-java github repo.

The Java Kerberos authenticator has a number of dependencies that are detailed in the Maven POM file for the AMPSKerberos project.

Below are two different JAAS configuration options. The first example will use Kerberos credentials in the user’s Kerberos credentials cache or will prompt the user for a password to obtain the credentials. The second example utilizes a keytab to obtain the Kerberos credentials. When a JAAS configuration is utilized the java.security.auth.login.config property needs to be set to the path to the config file and the config file entry name needs to be passed to the AMPSKerberosGSSAPIAuthenticator along with the SPN.

TestClient {com.sun.security.auth.module.Krb5LoginModule requiredisInitiator=trueprincipal="username"useTicketCache=truestoreKey=true};TestClient {com.sun.security.auth.module.Krb5LoginModule requiredisInitiator=trueuseKeyTab=truekeyTab="/path/to/username.keytab"principal="username@REALM"storeKey=truedoNotPrompt=true};

In order to execute the below code the following needs to be done:

  • If using GSSAPI, create the appropriate JAAS config, uncomment the AMPSKerberosGSSAPIAuthenticator line and specify -Djava.security.auth.login.config=/path/to/jaas.conf when starting the app.
  • If running on Windows and using SSPI uncomment the AMPSKerberosSSPIAuthenticator line.
  • The username and hostname variables need to be set to the user name you are authenticating as and the fully qualified name of the host AMPS is running on.
importcom.crankuptheamps.authentication.kerberos.AMPSKerberosGSSAPIAuthenticator;importcom.crankuptheamps.authentication.kerberos.AMPSKerberosSSPIAuthenticator;importcom.crankuptheamps.client.Authenticator;importcom.crankuptheamps.client.Client;importcom.crankuptheamps.client.exception.ConnectionException;publicclassKerberosAuthExample{publicstaticvoidmain(String[]args)throwsConnectionException{Stringusername="username";Stringhostname="hostname";Stringamps_spn="AMPS/"+hostname;Stringamps_uri="tcp://"+username+"@"+hostname+":8095/amps/json";// Authenticator authenticator = new AMPSKerberosGSSAPIAuthenticator(amps_spn, "TestClient");// Authenticator authenticator = new AMPSKerberosSSPIAuthenticator(amps_spn);Clientclient=newClient("KerberosExampleClient");try{client.connect(amps_uri);client.logon(5000,authenticator);}finally{client.close();}}}

Authenticating using C++

For Kerberos authentication using C++ there are two different Authenticator implmentations, one for GSSAPI based authentication and one for SSPI based authentication. GSSAPI is the only option for authentication when running on Linux, but, unlike Java, it is not supported on Windows. Specifically, AMPSKerberosGSSAPIAuthenticator is used when running on Linux and AMPSKerberosSSPIAuthenticator is used when running on Windows.

The C++ Kerberos authenticator code can be found in the amps-authentication-cpp github repo.

The C++ Kerberos authenticator for Linux (GSSAPI) has a dependency on the GSSAPI libs that are part of the krb5 distribution.

In order to execute the below code the following needs to be done:

  • The username and hostname variables need to be set to the user name you are authenticating as and the fully qualified name of the host AMPS is running on.
#include <ampsplusplus.hpp>#include <string>#ifdef _WIN32#include "AMPSKerberosSSPIAuthenticator.hpp"#else#include "AMPSKerberosGSSAPIAuthenticator.hpp"#endifintmain(){std::stringusername("username");std::stringhostname("hostname");std::stringamps_spn=std::string("AMPS/")+hostname;std::stringamps_uri=std::string("tcp://")+username+"@"+hostname+":8095/amps/json";#ifdef _WIN32AMPS::AMPSKerberosSSPIAuthenticatorauthenticator(amps_spn);#elseAMPS::AMPSKerberosGSSAPIAuthenticatorauthenticator(amps_spn);#endifAMPS::Clientclient("KerberosExampleClient");client.connect(amps_uri);client.logon(5000,authenticator);}

Authenticating using C#/.NET

For Kerberos authentication using C# there is a single module, AMPSKerberosAuthenticator, for authentication on Windows.

The C# Kerberos authenticator code can be found in the amps-authentication-csharp github repo.

The C# Kerberos authenticator has a single dependency on the NSspi NuGet package.

In order to execute the below code the following needs to be done:

  • The username and hostname variables need to be set to the user name you are authenticating as and the fully qualified name of the host AMPS is running on.
usingAMPS.Client;usingAMPSKerberos;classKerberosAuthExample{staticvoidMain(string[]args){stringusername="username";stringhostname="hostname";stringamps_spn=string.Format("AMPS/{0}",hostname);stringamps_uri=string.Format("tcp://{0}@{1}:8095/amps/json",username,hostname);AMPSKerberosAuthenticatorauthenticator=newAMPSKerberosAuthenticator(amps_spn);using(Clientclient=newClient("KerberosExampleClient")){client.connect(amps_uri);client.logon(5000,authenticator);}}}

Server Chooser

When using a server chooser the get_authenticator function needs to be implemented and it must return the appropriate authenticator for the server you are connecting to. In the case that the server chooser is configured to return URIs for different hosts, then an authenticator configured with the correct SPN needs to be returned.

Below is an example of a server chooser implementation in python that uses multiple hosts.

importAMPSimportamps_kerberos_authenticatorfromurlparseimporturlparseUSERNAME='username'HOSTNAME1='hostname1'HOSTNAME2='hostname2'classKerberosAuthServerChooser(AMPS.DefaultServerChooser):def__init__(self):super(KerberosAuthServerChooser,self).__init__()self.authenticators={}defget_current_authenticator(self):hostname=urlparse(self.get_current_uri()).hostnameifhostnameinself.authenticators:returnself.authenticators[hostname]spn='AMPS/%s'%hostnameauthenticator=amps_kerberos_authenticator.create(spn)self.authenticators[hostname]=authenticatorreturnauthenticatordefreport_failure(self,exception,connectionInfo):printexceptiondefmain():client=AMPS.HAClient('KerberosExampleClient')chooser=KerberosAuthServerChooser()chooser.add('tcp://%s@%s:8095/amps/json'%(USERNAME,HOSTNAME1))chooser.add('tcp://%s@%s:8095/amps/json'%(USERNAME,HOSTNAME2))client.set_server_chooser(chooser)client.connect_and_logon()if__name__=='__main__':main()

Admin Interface Authentication

With an OS and browser that is properly configured for Kerberos authentication, it is possible to authenticate against the AMPS Admin Interface using Kerberos via a browser.

The curl command can also be used to authenticate against the admin interface when the OS is properly configured and curl has been built with Kerberos support.

`curl -v --negotiate -u : http://hostname:admin_port/amps/instance/config.xml`

It is also possible to programmatically authenticate with the admin interface. Below is an example using python.

#!/usr/bin/env pythonimportamps_kerberos_authenticatorimportrequestsHOSTNAME='hostname'ADMIN_PORT=0HTTP_SPN='HTTP/%s'%HOSTNAMEADMIN_URL='http://%s:%s/amps/instance/config.xml'%(HOSTNAME,ADMIN_PORT)defmain():authenticator=amps_kerberos_authenticator.create(HTTP_SPN)token=authenticator.authenticate(None,None)# No user and no return tokenr=requests.get(ADMIN_URL,headers={'Authorization':'Negotiate %s'%token})printr.text

Replication Authentication

Securing AMPS for replication requires having a replication Transport with Authentication enabled as well the use of an Authenticator in the Replication/DestinationTransport. The libamps_multi_authenticator module provides the client side authentication support for the replication connection.

The below sample AMPS configuration uses environment variables for the Kerberos configuration elements. The following variables would need to be set correctly for this config to function as expected. A second instance would also need to be configured.

  • AMPS_A_SPN - Set to AMPS/hostname where hostname is the fully qualified name of the host AMPS A is running on.
  • AMPS_B_SPN - Set to AMPS/hostname where hostname is the fully qualified name of the host AMPS B is running on.
  • AMPS_A_KEYTAB - Set to the path of a Kerberos keytab containing entries for the AMPS SPN for the A instance.
  • AMPS_USER_KEYTAB - Set to the path of a Kerberos keytab that contains an entry for the user principal that you want to use to authenticate to AMPS B.
<AMPSConfig><Name>AMPS_A</Name><Authentication><Module>libamps-multi-authentication</Module><Options><Kerberos.SPN>${AMPS_A_SPN}</Kerberos.SPN><Kerberos.Keytab>${AMPS_A_KEYTAB}</Kerberos.Keytab></Options></Authentication><Transports><!-- Authentication enabled via the top-level Authentication configuration --><Transport><Name>json-tcp</Name><InetAddr>8095</InetAddr><Type>tcp</Type><Protocol>amps</Protocol><MessageType>json</MessageType></Transport><!-- Authentication enabled via the top-level Authentication configuration --><Transport><InetAddr>8105</InetAddr><Name>amps-replication</Name><Type>amps-replication</Type></Transport></Transports><Replication><Destination><Name>AMPS_B</Name><SyncType>sync</SyncType><Transport><InetAddr>localhost:9999</InetAddr><Type>amps-replication</Type><Authenticator><Module>libamps-multi-authenticator</Module><Options><Kerberos.Keytab>${AMPS_USER_KEYTAB}</Kerberos.Keytab><Kerberos.SPN>${AMPS_B_SPN}</Kerberos.SPN></Options></Authenticator></Transport><Topic><MessageType>json</MessageType><Name>.*</Name></Topic></Destination></Replication><Modules><Module><Name>libamps-multi-authentication</Name><Library>libamps_multi_authentication.so</Library></Module><Module><Name>libamps-multi-authenticator</Name><Library>libamps_multi_authenticator.so</Library></Module></Modules>

    ...
</AMPSConfig>

To Guard and Protect

In this post, I’ve covered the basics of setting up AMPS for Kerberos authentication. If your site uses Kerberos, the team that manages that installation will have definitive answers on how Kerberos is configured in your environment.

In this post, we’ve intentionally kept the focus on AMPS. We haven’t delved into the depths of troubleshooting Kerberos installations, or the considerations involved in setting up a Kerberos infrastructure. We encourage you to work with the team responsible for your company’s Kerberos installation when configuring AMPS, since many of the most common problems in setting up Kerberos authentication are a matter of ensuring that the credentials provided match what the Kerberos server expects – which is most easily done when the owners of the Kerberos configuration are also involved.

We’re very proud to have Kerberos support available out of the box with AMPS. Let us know how the Kerberos support works for you!

[Edited on 7/3/2019 to add information about the JavaScript Kerberos authenticator for Node.js applications.]

First Things First: Priority Queues

$
0
0

dial labelled 'priority' with hand about to turn the dial

AMPS queues provide a simple way to distribute work across a group of consumers. By default, AMPS queues provide work in first-in-first-out fashion: that is, the oldest message in the queue is provided to subscribers first, then the next oldest, and so on. For some problems, though, it’s important that the most important work happen first, even if the most important message in the queue isn’t actually the oldest. For example, a monitoring system may want to log and analyze all events, but may want to process a critical alert immediately, even if there are hundreds of informational events ahead of that alert in the queue. Likewise, a compute grid may need to have time-critical requests processed before work that is less time-critical.

One approach for these problems would be to build a separate queue for the higher-priority messages, or to create dedicated “high priority” processors that use a content filter to retrieve only high-priority messages. Those approaches can work very well, but sometimes it’s important to have a solution that doesn’t require clients to be aware of the priority, or that allows a more flexible priority system rather than relying on a limited number of priority levels.

AMPS Priority Queues

With AMPS priority queues (available in 5.3.0 and higher releases), you can use the properties of the message to automatically set the priority of the message within the queue. To do this, you simply add a Priority to the configuration of the queue. The Priority tells AMPS how to calculate the priority of each message in the queue.

Unlike some other queueing systems, AMPS does not require the publisher to set an explicit priority (or even know that message delivery will be prioritized), and AMPS does not require a fixed set of priority levels or categories. This gives AMPS the ability to provide priority queues that are simple to set up, easy to use, and extremely flexible and adaptable as your application evolves. The details on how priority queues work are available in the Priority Queues section of the AMPS User Guide.

Here are a few examples.

A Basic Example

In the simplest case, creating a priority queue can be as easy as including the priority in the message, and using that field to set the delivery priority:

<Priority>/info/priority</Priority>

With a priority configuration like the one above, if you publish the following two messages to the AMPS queue, AMPS will deliver the second message from the queue before the first message:

{"message":1,"info":{"priority":1,"note":"Low priority message"}}{"message":2,"info":{"priority":1000,"note":"High priority message"}}

Notice that, in AMPS, priority is always sorted so that the highest priority value is delivered first. (Even if you are used to considering “priority 1” or “priority 0” as meaning “highest priority”, because 100 is greater than 1, AMPS delivers the message with priority 100 first.

Complex Expressions

The Priority element can include any AMPS expression that produces an integer. This means that more complicated epxressions are possible, and that, in many cases, you can use data that is already contained in the message to calculate the priority.

For example, you might want to process orders that have the largest total value before orders with lower values (as computed by the price of the item times the quantity of the item in the order). In this case, there’s no need for a publisher to add an extra field to the message, since all of the information necessary to calcualate the priority is already there.

<!-- added to a Queue configuration eleement --><Priority>(/price * /quantity) as /priority</Priority>

The format for the expression is the same format used for constructing fields. All of the functions that you can use in a standard AMPS filter are available. AMPS calculates the priority when it starts tracking the message for queue delivery (that is, when the message enters the queue), and delivers the message when all higher-priority messages have been delivered.

It’s also important to remember that there are no predetermined priority levels: there’s no need to determine ahead of time whether a message where /price * /quantity is 400 is a high-priority mesage, a medium-priority message, or a low-priority message. With AMPS, the message is higher priority than a message where /price * /quantity is 399, and lower priority than a message where /price * /quantity is 401. There’s no need for complicated configuration or arbitrary boundaries between priority levels.

Complete Example

With that background, here’s a complete example that includes a Queue definition, a publisher and a consumer.

Below is a full example of a Queue definition that has higher values of the /pri field in a JSON message prioritized over lower values:

<SOW><Queue><Name>q</Name><MessageType>json</MessageType><!-- simply use the /pri field of             published messages --><Priority>/pri</Priority></Queue></SOW><!-- This example assumes that q is recorded in     the transaction log for the instance -->

Next, we can show how the messages are published to the queue using the AMPS Python Client

importAMPS,random,json,timeCOUNT=10client=AMPS.Client("pri-pub-%d"%os.getpid())client.connect("tcp://localhost:9007/amps/json")client.logon()foriinxrange(COUNT):client.publish("q",json.dumps({"id":i,"pri":random.randrange(5),"ts":time.time()}))

In the example above, we are going to publish 10 messages to the priority queue we configured above q. Each message has a /pri field receiving a value between 0 and 4, and each message has a timestamp to help us track message order.

Consuming messages from the priority queue is identical to consuming regular queue messages. Simply subscribe to the queue topic, process, and ack the messages.

formsginclient.subscribe("q"):body=json.loads(msg.get_data())print"Message with priority: %s"%(body["pri"])msg.ack()

Notice that when you run this sample, AMPS returns messages in priority order (higher values of the pri field are returned first) rather than the publication order (which would show a lower id number first, with the values rising).

Views on Queues

AMPS provides support for views that use a queue as the underlying topic. These views show messages that are currently available for delivery to a consumer. Adding a materialized view of a queue topic is a common approach to create monitoring over the contents of a queue.

In the following example, the view is configured to enumerate each of the distinct priority levels in the priority queue, along with the number of messages in the queue, and the oldest timestamp. This simple view configuration can be used to ascertain whether the priority queue is functioning properly.

<View><Name>q-status</Name><MessageType>json</MessageType><UnderlyingTopic>q</UnderlyingTopic><Grouping><Field>/pri</Field></Grouping><Projection><Field>/pri as /pri</Field><Field>COUNT(/id) as /count</Field><Field>MIN(/ts) as /oldest_ts</Field></Projection></View>

Using the spark command that is bundled with AMPS, monitoring the state and progress of the priority queues becomes simple.

watch -n1 "~/spark sow -server localhost:9007 -type json \                       -topic 'q-status' -orderby '/pri'"

The results of this command would look something like the following when run using the publishes that were listed earler (although, of course, this will reflect the messages currently in the queue, so the results will depend on how many times you run the publisher, what random priority values were assigned, and whether you have acknowledged messages from the queue).

{"count":22,"oldest_ts":1547650270.46372,"pri",0}{"count":22,"oldest_ts":1547650270.46447,"pri",1}{"count":22,"oldest_ts":1547650270.46455,"pri",2}{"count":22,"oldest_ts":1547650270.46462,"pri",3}{"count":22,"oldest_ts":1547650270.46492,"pri",4}Totalmessagesreceived:5(1666.67/s)

For an actual monitoring system, we would use a sow_and_subscribe command to receive the current state and process updates. For example purposes, we use watch at the command line and re-run the query from scratch every time because this makes the output easy to view in a Linux terminal.

Conclusion

AMPS provides a priority queue that is simultaneously familiar to existing priority queue semantics, yet provides the flexibility for queue semantics to go beyond merely assigning priority.

How will you use priority queues?

[Edit: 2019-11-14 Remove unused imports from python sample.]

Scaled-Out Batch Processing with AMPS Queue Barriers

$
0
0

runners at a starting line, waiting for the signal to startScaling out your data processing using AMPS queues allows you to dynamically adjust how many workers you apply to your data based on your needs and your computing resources. Larger orders coming in or more events to process? Just spin up more subscribers to your AMPS queue and let them take their share of the load. AMPS dynamically adjusts how many messages it gives to each consumer based on their available backlog and message processing rate, and your work gets done without needing costly reconfiguration or re-partitioning.
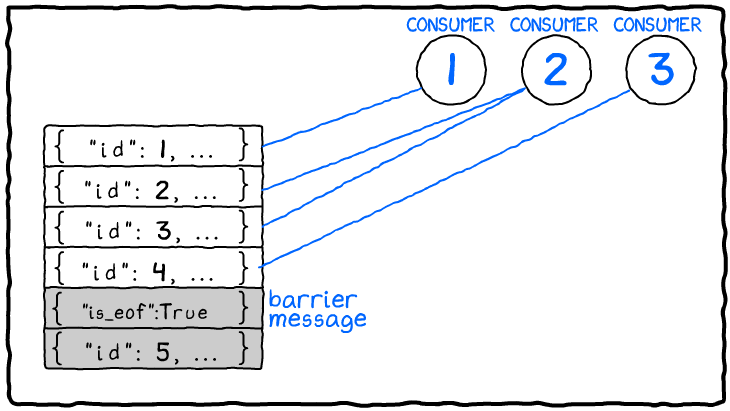
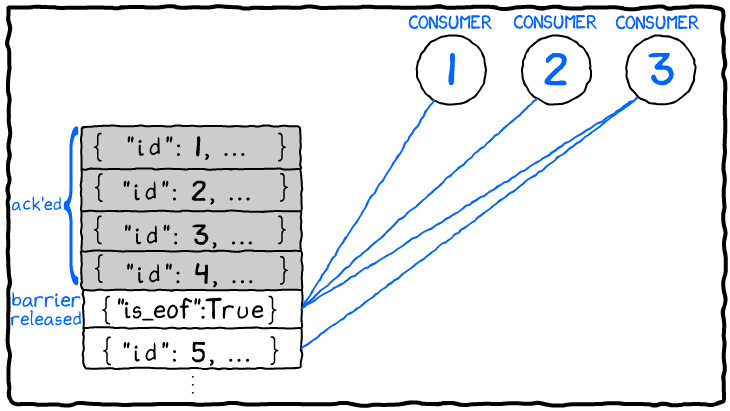
Scale-out with queues works great when each message is an independent unit of work. Each subscriber works indenpendently. The subscribers work in competition with one another, each processing messages as fast as possible, acknowledging messages back to AMPS as quickly as possible, and receiving more messages as quickly as possible. AMPS includes features to intelligently deliver messages to consumers that are processing quickly, to avoid a consumer ever having to wait for work when work is available.

Some problems require coordination, however. In this article, we look at a typical situation where you want multiple consumers competing to process messages as fast as possible, but you also need them to just work on the same batch of data and to wait for each other to finish and move to the next batch in unison. We’ll examine a powerful new feature in AMPS queues, Barrier Expressions, that allows consumers to coordinate and work in concert to efficiently process data.

Starting Small

Let’s imagine that we run a very successful nationwide chain of spatula stores, Spatula City. Each of our 1200 stores transfers their individual sales and customer interaction data every night. We aim to process this data as quickly as possible so we can make real-time business decisions based on actual spatula trends. We use this data to update a global inventory management system, and then in aggregate, use the data for ever-more-advanced predictive analytics.

When our business was small we could get this done with a pretty simple program:

# Simple file processing example# (before adding AMPS queues)## For sample purposes, assume that# spatula_utils includes an existing# library for database connectivity,# and so forth.fromspatula_utilsimport*importsysdatabase=Database()db_conn=database.connect()# For each line in each file, # the program does a nightly update.# After every file is processed,# predictive analytics start.processed_count=0fordaily_fileinsys.argv[1:]:f=open(daily_file)forlineinf.xreadlines():clean_data=preprocess(line)json_data=convert_to_json(clean_data)update_inventory_system(json_data)db_conn.insert(json_data)processed_count+=1ifprocessed_count%100==0:printprocessed_countprint"Done for the day! Starting predictive analytics."run_predictive_analytics(db_conn)

As we processed each row of data from each store, we’d take a moment to update our inventory control system. Once the whole day’s set of files was processed, we’d run our larger analytics.

Batches Get Bigger

This system works great when all of the work can be done by a single process in a reasonable amount of otime. As our analytics become more advanced, however, we need to get through our file loading much more quickly. And as the number of stores and their sales volume increases (everyone needs spatulas!), our single process for file loading desperately needs scale.

AMPS message queues to the rescue! Let’s configure and build an AMPS message queue and publisher to help us distribute this workload efficiently:

AMPS Configuration File

Here’s a simple configuration file to distribute work over a set of subscribers:

<AMPSConfig><SOW><Queue><Name>NIGHTLY_SALES_DATA</Name><MessageType>json</MessageType><Expiration>24h</Expiration></Queue></SOW>
  ...
  <!-- NIGHTLY_SALES_DATA is also       recorded in the transaction log --></AMPSConfig>

In the AMPS configuration file, we’ve created a single message queue that will be used to distribute our data in a JSON format. Any number of consumers can connect to this instance and subscribe to the queue to become consumers. This message queue will automatically be configured with “at-least-once” semantics, meaning that a message will remain in the queue until it has been delivered to a consumer and acknowledged. Now let’s examine the code for our publisher and consumers:

Publisher

As mentioned above, the publisher reads a set of files and publishes information from each line of the file to AMPS, for a consumer to process:

# Simple AMPS queue publisher# example.# Assume that spatula_utils has# database classes and so on.fromspatula_utilsimport*importsys,osimportAMPSdatabase=Database()db_conn=database.connect()client=AMPS.Client("publisher-%d"%os.getpid())client.connect(...)client.logon()# For each file, publish the work# to be processed to the AMPS queueprocessed_count=0fordaily_fileinsys.argv[1:]:f=open(daily_file)forlineinf.xreadlines():clean_data=preprocess(line)ifprocessed_count%100==0:printprocessed_countclient.publish("NIGHTLY_SALES_DATA",clean_data)processed_count+=1## Wait until everything is processed...## ... but how long should we wait?time.sleep(...)print"Done for the day! Starting predictive analytics."run_predictive_analytics(db_conn)

Consumer

The consumer is just as simple as the publisher. For each message from AMPS, the consumer processes the message, and then acknowledges to the server that the work is done. (We are not tuning queue delivery for maximum performance here, just showing the simplest way to convert the existing process.)

# Read from an AMPS queue and# process sales data.# Assume that spatula_utils has# database classes and so on.fromspatula_utilsimport*importsys,os,socketimportAMPSdatabase=Database()db_conn=database.connect()hostname=socket.gethostname()pid=os.getpid()unique_client_name="consumer-%s-%d"%(hostname,pid)client=AMPS.Client(unique_client_name)client.connect(...)client.logon()print"%s: connected"%unique_client_nameprocessed_count=0formessageinclient.subscribe("NIGHTLY_SALES_DATA"):data=message.get_data()json_data=json.loads(data)update_inventory_system(json_data)db_conn.insert(json_data)message.ack()# Tell the server the message is completeprocessed_count+=1ifprocessed_count%100==0:print"%s: %d"%(unique_client_name,processed_count)# This should exit if nightly processing is done...# ... but how do we know for sure?

With just a few lines of code, we’re able to convert our single-threaded script into a fully-distributed system based on AMPS queues and scale our work out over any number of processors and hosts. We can now increase processing scale just by running another instance of the consumer. But we have one critical, unsolved problem: how do we know when we’re done?

Endings Can be Difficult

Here’s what we know: all of the data will eventually be processed and loaded into the database. Even if a processor fails midway through, AMPS will redeliver that work to another processor, until every message in the queue is processed.

What we don’t know, though, is when the day’s worth of data is finished being loaded into the database. Each consumer runs independently, and doesn’t need to know whether the other consumers are finished. In fact, that’s the whole point: we can add as many consumers as we need to just by starting up another process. They don’t need to do any sort of coordination: AMPS queues automatically handle message distribution.

In our publisher, we need a way to know once all of our messages are fully processed since we need to run analytics at the end. In our consumers, we’d like to be able to exit gracefully once the batch is completed.

This problem is harder than it seems for a few reasons:

  • If the publisher were to wait for the queue to be completely drained, what happens if a consumer fails and returns a message back to the queue?
  • Maybe every consumer could somehow keep a separate topic up-to-date with every message that’s been processed. But how would that scale, and what if there’s a failure writing to that topic?
  • What if publishers want to start writing the next day’s data before the previous day is finished? You wouldn’t want consumers to march ahead into the next day’s data until the previous day is done. (That’s not a problem that Spatula City has now, but we have big dreams!)

These aren’t new problems, and we’ve seen all sorts of creative ways to signal the completion of a batch. Some are more failure-prone than others, and all of them require thinking about the myriad ways a job might get stuck or might be seen as completed when it’s really not. Some solutions require coordinating between consumers, or require a publisher to absolutely know in advance how much work there is to do, or involve guessing based on probability (“if no new messages have shown up to be processed in 60 seconds, I guess that must mean the publisher is done”).

Wouldn’t it be great if there was a way to clearly communicate to all consumers when messages up to a certain point had been fully processed, and to keep the next day’s messages from being processed until the current one is finished?

Introducing Queue Barriers

Consumers Receive Everything up to the Barrier Message. Nothing after the barrier message is eligible for delivery.

AMPS (starting with 5.3.1) has a unique, built-in way to solve problems like these. AMPS will identify specific messages in a message queue as barrier messages based on whether the message matches a BarrierExpression you configure. A barrier message won’t be delivered until all prior messages are delivered and acknowledged. Also, unlike typical queue messages (which are delivered to a single subscriber), when the barrier message is delivered, the barrier message will be delivered to all subscribers to the queue (provided their entitlements and content filter match, of course). Messages after a barrier message will not be delivered to any consumer until the barrier message has been released and delivered.

When the barrier message is released (becaues all previous messages are processed), the barrier message is delivered to all subscribers, and normal queue delivery begins with the message after the barrier message.

Let’s use a barrier message in our file-loading application to coordinate and scale-out our post-processing analytics! In our config file, we add one line of configuration to indicate how AMPS should determine if a message is a barrier message. We’ll simply add an “is_eof” field to the message when it demarcates the end of the day:

<AMPSConfig><SOW><Queue><Name>NIGHTLY_SALES_DATA</Name><MessageType>json</MessageType><Expiration>24h</Expiration><!-- Added BarrierExpression:            any message with is_eof = 1           will be considered a barrier message --><BarrierExpression>/is_eof = 1</BarrierExpression></Queue></SOW>
  ...
  <!-- NIGHTLY_SALES_DATA is also       recorded in the transaction log --></AMPSConfig>

In our publisher, we write a message that matches the BarrierExpression by including an “is_eof” when we’re done publishing the day’s spatula data. Unlike all of the other messages we’ve written, this message will be delivered to all consumers, and it will only be delivered once all of the previous messages we wrote are completely processed. This gives us a built-in way to know for sure that the day’s work has been processed by the consumers.

We alter our publisher to also consume our EOF message so that it knows when to run the analytics step:

# More effective AMPS queue publisher# example. This uses the BarrierExpression# configured for the queue to know# when consumers have finished work.# Assume that spatula_utils has# database classes and so on.fromspatula_utilsimport*importos,sysimportAMPSdatabase=Database()db_conn=database.connect()client=AMPS.Client("publisher-%d"%os.getpid())client.connect(...)client.logon()processed_count=0fordaily_fileinsys.argv[1:]:f=open(daily_file)forlineinf.xreadlines():clean_data=preprocess(line)ifprocessed_count%100==0:printprocessed_countclient.publish("NIGHTLY_SALES_DATA",clean_data)processed_count+=1# Publish EOF, then wait for it to be sent back to# us indicating all prior messages are consumed# The subscription uses a content filter so only# the EOF matcheseof_stream=client.subscribe("NIGHTLY_SALES_DATA","/is_eof = 1")client.publish("NIGHTLY_SALES_DATA",'{"is_eof": 1}')print"Waiting for consumers to finish..."# Wait for the EOFformessageineof_stream:breakprint"Done for the day! Starting predictive analytics."run_predictive_analytics(db_conn)

Great! Our publisher knows when all of the data it’s written has been fully processed. Let’s modify our consumer to look for this EOF message and use that message to terminate:

# Read from an AMPS queue and# process sales data. This version# uses a queue barrier to know when# processing for the day is complete.# Assume that spatula_utils has# database classes and so on.fromspatula_utilsimport*importsys,os,socketimportAMPSdatabase=Database()db_conn=database.connect()hostname=socket.gethostname()pid=os.getpid()unique_client_name="consumer-%s-%d"%(hostname,pid)client=AMPS.Client(unique_client_name)client.connect(...)client.logon()print"%s: connected"%unique_client_nameprocessed_count=0formessageinclient.subscribe("NIGHTLY_SALES_DATA"):data=message.get_data()json_data=json.loads(data)# When we see the barrier message, we can exit# because there's nothing left to process.if"is_eof"injson_data:breakupdate_inventory_system(json_data)db_conn.insert(json_data)message.ack()processed_count+=1ifprocessed_count%100==0:print"%s: %d"%(unique_client_name,processed_count)print"%s: EOF received, exiting"%unique_client_name

Once every non-barrier message has been consumed by a queue consumer, AMPS will send the single barrier message from our publisher to every consumer. The consumer does not need to alter its AMPS subscription to receive this message, and the consumer can exit as soon as it receives a message letting it know that the publisher has finished.

Conclusion

Batch processing remains an important part of many data scenarios. AMPS Message Queues let you scale-out processing of batches in a low-latency fashion by allowing you to treat the data in your batch as independent messages, and yet retain the semantics of a “batch” across queue consumers.

Best Web Grids for 2020

$
0
0

Learning to love the grid

Many things have changed in the webapp world since we last did a grid comparison, way back in 2017.

Chrome is increasing its domination in the market of browsers. Edge ditched its own web engine and is essentially a Microsoft clone of Chrome now. Firefox is in decline, has less than 10% of the market and Mozilla recently had to let go 70 of its employees as its revenue keeps falling. Meanwhile, more companies than ever are working on, or considering creating modern web applications that will replace their legacy desktop products and embrace a ubiquitous model for desktop and mobile platforms. The combination of converging technology and increasing development of web applications makes it an exciting time – and make technology choices more important than ever.

In our last evaluation, we already established that web interfaces can be as flexible, feature-rich, and robust as their desktop analogues. The centerpiece of any modern data-intensive web application is a grid, so now it’s time to review the most popular web grids on the market and see which one is the best pick for 2020!

Contestants

Let me introduce the contestants – these are all powerful, well established grid engines that are widely used to build modern snappy web applications.

  • ag-Grid 22.1.1: “The Best JavaScript Grid in the World” is an extremely feature rich, good looking and well documented grid that claims to be even better than before. We found that it has definitely improved since the last time we tested it.

ag-Grid tableag-Grid 22.1.1

  • Sencha Ext JS 7.0.0: A part of “the most comprehensive JavaScript framework for building data-intensive applications”, this grid claims it can “handle millions of records”. Perhaps the most upsetting part about testing this grid was its restrictive license and a requirement to provide your email and phone number so they can spam you – not cool, Sencha, learn from ag-Grid on how it’s done right.

Sencha Ext JS tableSencha Ext JS 7.0.0

  • Kendo UI Grid 2019.3.1023: Allows you to “quickly build eye-catching, high-performance, responsive web applications”. We’re about to find out if, in fact, it ken do it.

Kendo UI tableKendo UI Grid 2019.3.1023

  • w2ui 1.5: A nice contrast to big JavaScript frameworks, this grid can do most of what other grids offer, but is tiny and lightweight. In fact, it is 9 times smaller than Ext JS and 7 times smaller than Kendo UI.

w2ui tablew2ui 1.5

  • FancyGrid 1.7.87: A very good looking grid with a large list of features. Perhaps by pure coincidence they never mention performance of the grid. Unfortunately, it was way too slow in our tests, so we excluded it from the final results. Without pagination, FancyGrid can only handle ~10K records without having significant performance issues, and that’s well below our testing threshold.

FancyGrid tableFancyGrid 1.7.87

  • Webix DataTable 4.3.0: part of Webix framework, DataTable component provides a highly efficient grid that delivers blazing fast performance. We included Webix here because it was the best grid in our previous comparison.

Webix tableWebix DataTable 4.3.0

We excluded SlickGrid and HyperGrid from this comparison. SlickGrid, one of the best grids from the previous test, despite all of its benefits, is currently in life-support mode, with only a moderately active fork of the original product being available. HyperGrid, a product that we expected to become mainstream by now is still a niche offering that never gained considerable traction in the web development community. Perhaps there’s a future for Canvas-based grids, though at the present moment they are losing the battle – some of the HTML5 grids are getting very close in terms of performance, and also have the benefit of better customization due to the DOM access. Having said that, HyperGrid’s recent experiments in combining the grid engine with a web-assembly based data engine can result in a significant increase in performance and create a new class of ultra fast web applications. We’re still paying attention to Hypergrid.

Tests we run

Our main focus is user experience. The grid should look good, feel snappy, hold a huge amount of data and yet still go easy on memory as it often is a limited resource. A good grid shows results of a query with subsequent updates that occur to that grid, such as deletes, updates, and new records. On average, we used a message size of 140 Bytes– it’s big enough to show meaningful information and is small enough to fit millions of such messages into the grid without taking all the available RAM on our test system. The following set of tests should give us a good picture of how the selected grids will perform in a real world situation:

  • Rendering Time: How much time it will take to render the initial portion of data. Fast rendering is important so that the web application loads and is ready to work as soon as possible. Another situation when fast rendering might be useful is switching data sets to display in the grid.

  • Frames Per Second (FPS): The more FPS a grid can produce while being used, the smoother and more responsive it looks and feels. Significant changes in FPS are perceived as freezes and should be avoided as much as possible.

  • Memory Consumption: If a grid is memory efficient, it can work well and do more on a device with less memory, such as mobile devices and laptops. In our test we will measure how many rows/records a grid can render using no more than 2 GB of RAM. Last time we used 4 GB as the target value, but people in comments made a valid point that some entry level devices, such as office desktops, smartphones, and Chromebooks might only have 4 GB available, so we lowered the threshold accordingly.

  • Live Updates: Rendering the initial portion of data is important, but that’s not enough if a grid cannot smoothly render changes in real time. According to MDN, “A frame rate of 60fps is the target for smooth performance, giving you a time budget of 16.7ms for all the updates needed in response to some event.” In this test we will measure how many rows per second we can add to the grid while maintaining maximum FPS and experience no lagging.

Environment

Hardware
  • CPU: 6th Generation Intel® Core™ i7-6820HQ Processor (8MB Cache, up to 3.60GHz)
  • GPU: NVIDIA® Quadro® M1000M 4GB
  • RAM: 64GB DDR4 2133 MHz
  • Storage: 1TB PCIe SSD
Software
  • OS: Ubuntu 5.3.0-27 GNU/Linux x86_64
  • Browser: Google Chrome Linux 79.0.3945.130 (64-bit)

We don’t test other browsers, due to the factors I mentioned in the beginning of this post. Chrome and its clones (including Safari which is using WebKit) are, at this point, the only significant platform that people use. Some people don’t like this fact which reminds them of the sad era of Internet Explorer dominance, however it’s not the same situation. This time the platform is free and open for everyone – and being packaged into independent browsers by multiple independent teams. This fact ensures there will be no stagnation, violation of standards, or reliance on vendor-lock-in solutions. On the side note, web developers are happier than ever!

Time to Render

Once the initial data portion of a query is loaded (typically, in a separate WebWorker, especially if it’s large), we need to display it in the grid. Considering the size of the initial portion, all grids did great, but as usual, some did better than others.

Grid Comparison: Rendering Time

Even though every grid in our tests is using virtualization, ag-Grid’s Viewport model was absolutely the best – it feels like there’s no limit to amount of data it can handle! Webix’s results are second best. w2ui has a somewhat linear dependency for the rendering time required which might be a limiting factor for extremely large datasets.

Rendering Performance in Dynamic: Scroll Tests

Okay, we have our data loaded and rendered. Is the grid still responsive and snappy? Can we look through these rows without having a feeling that we’re watching a slide show? To make this test more objective, we measured FPS using Chrome Developer Tools. Scrolling using Touchpad/Mouse wheel simulates slow scrolling, while scrolling by dragging the scrollbar will show how the grids are optimized for very fast scrolling. As before, we test for each dataset size.

Grid Comparison: Scrolling FPS -- Mouse / Touchpad

Grid Comparison: Scrolling FPS -- Scrollbar

ag-Grid and Webix are clear winners, followed by Ext JS, which demonstrated great performance and is very well optimized out-of-the-box for buttery smooth rendering regardless of the dataset size. On the other hand, Kendo didn’t perform as well. In our test, every grid except Kendo felt snappy and smooth.

Memory Efficiency

This is a test that answers one simple question – how much data can we display in the grid on an entry level desktop?

Memory Consumption

Due to the tricks that ag-Grid provides for its row model, data consumption is extremely efficient and almost identical to Webixagain. The two cool kids absolutely destroyed the rest of competition when it comes to memory efficiency. Kendo continues to disappoint us with 4x less memory efficiency than the winners.

Real Time Updates

Now the grid is loaded and rendered with all of the original data, but that’s not enough – without real-time updates, the dataset becomes irrelevant. This test starts with the 20,000 records and applies updates at an increasing rate, until the grid starts lagging.

Live Grid Updates

w2ui is simply mind blowing when it comes to real-time updates! Having said that, all contestants (except, again, Kendo) demonstrated great performance when it comes dynamic data updates. It’s worth mentioning that most grids allow batching grid updates and ag-Grid demonstrates insane performance.

Learning Curve

While users care about performance and look-and-feel of a grid, developers care about how easy it is to work with the grid and implement application functionality with it. Let’s see what each grid engine can offer in terms of documentation, examples, and support.

I’ve ranked the grids as follows:

  1. ag-Grid– Excellent documentation and examples. Commercial support is available.

  2. Webix– Almost as good as ag-Grid. The grid provides tons of examples and live demos, API is very well documented and easy to search and navigate. Commercial support is available.

  3. Kendo UI– Nice, well structured documentation and examples. Commercial support is available. The only downside is a restrictive license and lack of public access to the framework, as well as a private NPM repository, which makes it harder to begin evaluation.

  4. FancyGrid– Nice, clear, and concise tutorials and docs with editable live examples, but lacks built-in search. Commercial support is available.

  5. Sencha Ext JS– On the bright side, the docs are very well written, and live examples with the playground are amazing. Having said that, the documentation is in a poor state. It is extremely fragmented; most of it is divided into “classic” and “modern” parts, sample projects are spread into multiple versions of the API. Worse of all, links throughout docs often lead to earlier versions of the API and it’s possible to switch to an older API version and potentially get incompatible or deprecated code. Try to google extjs grid and you’ll see 4-6 various versions of the docs in search results). Some of the example links on the site don’t work (for example, “Buffered Scrolling”). Similar to Kendo, a restrictive license and lack of public access to the framework as well as a private NPM repository make it harder to begin evaluation and also result in unsolicited calls and emails. Commercial support is available.

  6. w2ui– Documentation is present, but feels a bit limited. There are a few examples but for most part it’s a trial and error process to make it work as expected. There’s no commercial support available, although it’s possible to order a training session if your company happens to have an office in California.

Conclusion

We took a look at some of the great modern web grids. Test results prove the point that web interfaces combined with modern technologies can provide a highly responsive and well performing user interface.

This time, the winners are:

  1. ag-Grid: Absolute winner! It’s greatly improved since the last time, and I tend to agree that it is perhaps the best HTML5 grid available today.
  2. Webix: Excellent performance in all categories, great API and documentation – this is a great alternative to ag-Grid although not as robust when it comes to integration with modern applications built in React and Angular.
  3. Ext JS: The documentation is a mess, but it performs really well and working with it was nice and easy. It sure does have every possible feature you can imagine in a grid engine!

Honorable mention: w2ui. It wasn’t the fastest, but it is very compact and simple to work with. If you’re looking for a low calorie alternative to the Enterprise giants, this is a great pick.

Hopefully, these results can help steer you in the right direction of selecting the best web grid for your next project. As you can see, some of the grids were more performant along several dimensions so that gives you some choice and ability to cater to your specific requirements.

For users who want to try these grids in action, we’ve prepared a GitHub repository with the sample projects for each grid used in the above tests. Did we miss something? Do you know a great grid we should totally try? Let us know what you think!

From Zero to Fault Tolerance Hero with AMPS Replication

$
0
0

xkcd style stick man comic that describes a boss asking a programmer how their AMPS application handles fault tolerance.

In real world systems, networks fail, components need to be replaced, servers need maintenance. Successful enterprise grade applications need to be designed with fault tolerance in mind! AMPS sets you up for success with features designed for robust fault tolerance and high availability.

Key to these features is AMPS replication– ensuring that messages are reliably distributed to more than one server. Planning for a disaster can be hard, but AMPS replication doesn’t have to be daunting.

That’s why we are bringing you a series of detailed blog posts that will take you from fault tolerance newbie to replication pro.

Starting Simple

AMPS supports complex replication topologies containing many AMPS instances, but first, we have to start with the fundamental building blocks. In this first post, we are going to describe the basic configuration settings needed to bring your AMPS deployment into a replicated configuration.

We’ll set up a simple configuration with a single topic replicated between two AMPS instances.

The First Instance

We start by giving the AMPS instance a name as usual. When we’re replicating an instance the name is important, because this is what identifies this instance to other instances of AMPS. It’s important that the name be unique among the set of replicated instances, and it shouldn’t have any weird characters, but it doesn’t have to be especially exciting otherwise. So we’ll use AMPS-Replication-A for this one.

Then we give the instance a Group tag. The Group tag is used by AMPS to represent regions or clusters of instances. As you will see when we define the replication destination, the Group name is the primary way in which amps verifies that it has connected to the correct destination.

Note: The Group tag is verified by the upstream AMPS instance at the time of connection, not when the server first starts up. (And if you don’t set a Group, AMPS uses the Name of the instance as the group – a group of one, if you will.)

<AMPSConfig><Name>AMPS-Replication-A</Name><Group>DataCenter-1</Group>

  ...
Let’s Define Some Transports

Transports allow connections into the AMPS instance. For this sample, we will create two transports.

The first transport is for standard client traffic to this instance. There is nothing special here. Pay attention to the second transport we define. This is the important one for replication.

AMPS uses a dedicated protocol to replicate messages between instances. The amps-replication protocol is a proprietary format that allows AMPS to efficiently compress and multiplex the replicated message streams so you get the most out of your network.

The instance can receive messages from any number of upstream instances on this transport, so we only need one incoming transport, regardless of how many servers will replicate to this instance.

The Name field of a transport is an identifier string used for debugging purposes such as log messages. Name can be anything, but to help make debugging replication easier, we recommend that the Name of the Transport match the value of the Type for the amps-replication transport.

<Transports><!-- Transport for clients: accept any known message         type over tcp. --><Transport><Name>any-tcp</Name><Type>tcp</Type><InetAddr>9007</InetAddr><Protocol>amps</Protocol></Transport><!-- The amps-replication transport is required.          This AMPS instance will receive replication messages         on this transport. The instance can receive messages from any         number of upstream AMPS instances on this transport.         However, regular clients cannot connect         on this port, since this port uses the replication protocol. --><Transport><Name>amps-replication</Name><Type>amps-replication</Type><InetAddr>localhost:10004</InetAddr></Transport></Transports>

Notice that we’re not saying anything here about what the incoming replication messages contain, where they’re from, or anything like that. That’s not the concern of this instance – in AMPS, the source of the data controls replication, as we’ll see later on.

Topics and Transaction logs

This is a standard pub/sub topic that is configured to be stored in a transaction log. The one requirement for a replicated topic is that it must be stored in a transaction log. AMPS replicates exactly the information that is written to the local transaction log. The topic is not required to be declared anywhere else.

<TransactionLog><JournalDirectory>./journal-A/</JournalDirectory><Topic><Name>orders</Name><MessageType>json</MessageType></Topic></TransactionLog>
Look Mom, no SOW

If you’re used to other systems, where you have to predeclare topics, or if you typically use topics in the SOW (which have to be defined so AMPS can handle associating messages into a record), let’s just pause here for a minute.

XKCD style comic showing a surprised programmer

Let me repeat that last point, “the topic is not required to be declared anywhere else!”

If it’s in the transaction log, you can replicate it.

The Replication Block

All of the building blocks are in place for replication! Now, all we need to do is tell AMPS how to replicate the topic. This is where the magic happens.

AMPS replication is push based. Each replication block describes what messages will be replicated and what destination those messages will be pushed to.

The most important configuration is the name (and message type) of the topic we want to replicate. For this example we define a single topic, but you can define any number of topics or even a regular expression. All matching topics will be replicated to the destination node.

<Replication><Destination><Topic><MessageType>json</MessageType><!-- The Name definition specifies the name of the topic                   or topics to be replicated. The Name option can                    be either a specific topic name or a regular expression                   that matches a set of topic names. --><Name>orders</Name></Topic>
Group

Since we’re sending business data to another instance of AMPS so that it is available there when we need it, it’s important to be sure that this connection reaches the expected downstream instance.

The group needs to match the name of the group that the downstream instance has defined (that is, the top level Group tag in that instance’s configuration). At connection time, AMPS will report an error and not replicate if the group specified here does not match the group of the downstream instance.

<!-- within the Replication Destination --><!-- The group name of the destination instance (or instances).               The name specified here must match the Group defined                for the remote AMPS instance, or AMPS reports               an error and refuses to connect to the remote instance. --><Group>DataCenter-2</Group>
Sync or Async

The choice between sync or async determines when the server will respond to the message’s source that the message has been persisted.

The choice has no effect on the transfer of messages from the server to the replication destination.

As a good default, 60East recommends starting with sync. There are powerful use cases that take advantage of async replication, but that is for a future blog post.

<SyncType>sync</SyncType>
Destination Transports

Last, we set the network properties for the outgoing connection. The last part of the Replication destination is probably the most straight forward.

We need to define the address and type of the destination. The Type for both the source and the destination should always be amps-replication.

Remember that the amps-replication protocol is a proprietary format that allows AMPS to efficiently compress and multiplex the replicated message streams so you get the most out of your network.

<!-- The Transport definition defines the location                to which this AMPS instance will replicate messages.               The InetAddr points to the hostname and port of the               downstream replication instance. The Type for a                replication instance should always be amps-replication. --><Transport><InetAddr>localhost:10005</InetAddr><Type>amps-replication</Type></Transport></Destination></Replication>
Finish off this config

There are some parts of the configuration that we always include, no matter what the purpose of the instance is. This includes settings such as the admin interface, standard logging, and the closing AMPSConfig tag.

  • Note: This is a simple example to demonstrate replication. Your production config will likely have different logging settings and many other elements configured.
<Admin><InetAddr>localhost:8085</InetAddr></Admin><Logging><Target><Protocol>file</Protocol><Level>info</Level><FileName>./logs/instance-A-%Y%m%d-%n.log</FileName></Target></Logging></AMPSConfig>

Take a Breath

Congratulations! You have set up the first instance in a replicated pair. Remember, most of it is the same as a standard AMPS configuration.

Let’s summarize the big highlights for this configuration:

  • Define a group along with your instance name
  • Define the incoming replication transport; we only need one for the entire instance
  • Define the topic in the Transaction Log
  • Define the replication destination block; define where we are pushing message to (one for each place we replicate to)
  • Define the standard logging and admin configuration

The Second Instance

The second instance looks much like the first, with only a few differences.

The Name and Group are defined just like the first instance. Note, the name is different, since these are different instances (and the instance name needs to be unique across all replicated instances). Also notice that the group matches the group we put in the Destination for the first instance – after all, this is the group we’re planning for that Destination to reach!

<AMPSConfig><Name>AMPS-Replication-B</Name><Group>DataCenter-2</Group>

Just like the first instance, a transport for normal clients and a single separate replication transport is defined.

  • Note: the ports are unique, to allow both AMPS instances to run on a single host. In a production system, with multiple hosts, it’s common to use the same ports for the same purpose in every configuration.
<Transports><Transport><Name>any-tcp</Name><Type>tcp</Type><InetAddr>9008</InetAddr><Protocol>amps</Protocol></Transport><Transport><Name>amps-replication</Name><Type>amps-replication</Type><InetAddr>localhost:10005</InetAddr></Transport></Transports>

The Transaction log is defined exactly the same way as the first instance. Every replicated topic has to have the transaction log defined for that topic on every node. This is the one requirement for topics.

  • Remember AMPS replicates exactly the information that is written to the local transaction log.
<TransactionLog><JournalDirectory>./journal-B/</JournalDirectory><Topic><Name>orders</Name><MessageType>json</MessageType></Topic></TransactionLog>

AMPS replication is single-directional and push based. Messages always flow from a replication destination to a transport configured in the transport section.

The second instance has configured a replication destination that mirrors back to the first instance.

The Topic name in the destination must match the first instance.

<!-- All replication destinations are defined inside       the Replication block. --><Replication><!-- Each individual replication destination           requires a Destination block. --><Destination><!-- The replicated topics and their respective               message types are defined here.               AMPS allows any number of Topic definitions               in a Destination. --><Topic><MessageType>json</MessageType><!-- The Name definition specifies the name of the                   topic or topics to be replicated. The Name option                   can be either a specific topic name or a                   regular expression that matches a set of                   topic names. --><Name>orders</Name></Topic>

We use the group of the first AMPS instance here, since that is where this destination will deliver messages.

Just like the first instance, We use sync acknowledgment to be sure the other instance has the message.

<!-- The group name of the destination instance (or instances).               The name specified here must match the Group defined for               the remote AMPS instance, or AMPS reports an error and               refuses to connect to the remote instance. --><Group>DataCenter-1</Group><!-- Since we're building a configuration to replicate to the               other instance in a high availability pair,               we specify sync. We want the other instance to also store               the message before the message is considered               safely written. --><SyncType>sync</SyncType>

We set the address and port of the first instance – this tells the second instance to connect to the first instance and deliver messages there.

<!-- The Transport definition defines the location to which               this AMPS instance will replicate messages.               The InetAddr points to the hostname and port of the               downstream instance that will receive messages.               The Type for a replication instance needs to be               amps-replication, to match the type on               the downstream instance. --><Transport><!-- The address, or list of addresses,                   for the replication destination. --><InetAddr>localhost:10004</InetAddr><Type>amps-replication</Type></Transport></Destination></Replication>

Other configuration for the instance, such as logging, is independent of replication. This configuration does not have to match the replicated instance. As before, we turn on the admin interface and add logging.

<Admin><InetAddr>localhost:8085</InetAddr></Admin><Logging><Target><Protocol>file</Protocol><Level>info</Level><FileName>./logs/instance-B.%Y%m%d-%n.log</FileName></Target></Logging></AMPSConfig>
Some Notes

For this example, both instances of AMPS reside on the same physical host. Don’t use this configuration for performance testing!

When running both instances on one machine, the performance characteristics will differ from production, so running both instances on one machine is more useful for testing configuration correctness than testing overall performance.

To get the best performance when running more than one instance of AMPS on the same machine, 60East recommends disabling AMPS NUMA tuning in the AMPS configuration file and relying on the operating system NUMA management. See the AMPS Configuration Guide for details on how to disable NUMA in your configuration file.

Double check all your port numbers!

It’s important to make sure that when running multiple AMPS instances on the same host that there are no conflicting ports. AMPS will emit an error message and will not start properly if it detects that a port is already in use. That’s why these samples use different ports for each instance. If the instances were on different systems, we would likely use the same port each instance for a given purpose.

Conclusion

That’s it! You now have a replicated AMPS configuration. This will get you started with the basics, but there is a lot more to come.

Look for the coming posts in the series, where we build off of these fundamentals to make your AMPS deployment bullet proof in the face of fault tolerance:

  • Capacity Planning for replication
  • The AMPS High Availability client
  • Distributed SOWs and Distributed Queues
  • Server maintenance advice for replication such as optimizing disk space utilization and administrative actions
  • Complex replication topologies with multiple regions and strategies network degradation mitigation

XKCD style comic showing the boss suggesting more and more features while the programmer runs away.

For more detailed information check out the AMPS user manual, including the chapter on replication, advice on capacity planning, and as always, support@crankuptheamps.com is available to help with specific needs.

Visit a Range of Data with Bookmark Subscriptions

$
0
0

clouds over a snowy mountain range Even if you can’t make it to the great outdoors, AMPS now makes it easy to visit a range of data in the transaction log.

For years, AMPS has had the ability to use a bookmark subscription to replay messages from the transaction log. A bookmark subscription begins at a bookmark– a point in the transaction log – and the subscription would continue until the point that the application unsubscribed.

Bookmark subscriptions allow applications to resume subscriptions after being disconnected without losing messages, and also provide a way to recreate the sequence of messages to an instance (for example, for auditing or backtesting purposes).

Come to Think of It, Please Fence Me In

But what if an application only wants part of the transaction log (say, messages published between 48 hours ago and 24 hours ago)? The conventional way to solve this with AMPS is for the application to request a bookmark subscription with a timestamp from 48 hours ago to start the replay and then check each message as it arrives to decide if replay has passed the part of the transaction log that was of interest. If the message doesn’t already have a timestamp as part of the message data, the subscription would also need to use the timestamp option so that AMPS would include the time at which the message was processed on the local instance. This approach requires the AMPS server to send more messages than the application would process, since there is no way for the server to know where the application would stop processing messages. Since replay is typically very fast, this could easily be millions of messages more than the application needs.

Starting in the AMPS 5.3.2 preview, AMPS now provides a Bookmark Range feature. This feature lets you decide the exact range of messages for your bookmark subscription to receive. AMPS client applications can now receive an exact set of messages from a subscription during a specific timeframe, including open of business to close using timestamp bookmarks. No longer will clients have to check for that end marker message to see if they should unsubscribe. Now you can specify what specific bookmark you would like AMPS to stop sending messages for the subscription.

Where to Begin, Where to End

AMPS now allows the subscription to set not only the beginning point but also the ending point. Bookmark range also allows you to tell AMPS whether the subscription should receive the initial bookmark, as opposed to regular bookmark replays, where the bookmark provided is not included in the message set returned to the subscription. With a bookmark range, you specify the inclusiveness you would like for your beginning and ending range, and you can choose to include the beginning (and ending) bookmark.

To set a beginning and ending point, a subscription provides a subscription range specifier with the bookmark. The format of the subscription range specifier is as follows:

<begin_interval_specifier><begin_bookmarks>:<end_bookmarks><end_interval_specifier>

where the begin_interval_specifier is one of:

specifierbehavior
(Exclusive replay. The specified beginning bookmark will not be present in the replay.
[Inclusive replay. The specified beginning bookmark will be present in the replay.

and the end_interval_specifier is one of:

specifierbehavior
)Exclusive replay. The specified ending bookmark will not be present in the replay.
]Inclusive replay. The specified ending bookmark will be present in the replay.

Subscriptions may request a completed acknowledgement with their range subscription. AMPS will return the completed acknowledgement when the stopping point is reached.

All currently supported bookmark formats are allowed to be used in bookmark range, this includes timestamps.

To receive all messages matching your subscription for June 4, 2020 you could specify a bookmark like the following: [20200604T000000:20200605T000000). This bookmark tells AMPS to deliver all the messages that match the subscription beginning at midnight June 4 (inclusive) and ending at midnight June 5 (exclusive). (AMPS timestamps are in the UTC timezone, so if your business is in a different time zone, you can adjust the timestamp as needed.)

Plan for the Future

Currently bookmarks not in the transaction log are treated as unknown bookmarks. Subscriptions with unknown bookmarks are set to begin after the last message recorded in the transaction log at the point of subscription, this includes timestamps in the future. On a regular bookmark subscription with a future timestamp as the bookmark the subscription would begin immediately after the last message in the transaction log. The new bookmark range subscription feature supports future timestamps not being returned as the last message, but rather will hold the subscription open until the given timestamp. Future timestamps can be used in both the begin_bookmarks and the end_bookmarks. An application can now enter a subscription to collect all records for the full business day ahead and then complete, even when the application is started before business hours. The subscription would just set two future timestamps along with the inclusiveness that the application needs. AMPS will begin delivering messages at the start time specified and stop delivering at the end time specified. Again, a completed acknowledgement will be sent (if requested) at the point where the subscription ends.

Bookmark range also supports bookmark lists in both the beginning and ending point. AMPS will find the earliest bookmark in the starting list and the latest bookmark in the stopping list. The replay will then act as if those two bookmarks were given as the range start and stop bookmarks.

More Than Just Your Normal Open Ended Subscription

As you can see above, bookmark range can be used in a variety of ways. You can receive messages from a specific range in the past to retrace your steps or set up a future subscription to gather messages for the work ahead. In either case, AMPS automatically begins and ends the subscription exactly at the point you choose, without your application having to do any extra work, and without sending any unnecessary messages.

The new bookmark range feature can be combined with other awesome AMPS features including, but not limited to: filters, select list, and rate.

What are you most excited about with this new feature? How will you use this to make your applications more efficient? Let us know in the comments!


Great Web Grids for 2021

$
0
0

Learning to love the grid

Last year we published a very popular grid comparison which provided a good overview of several web grid engines commonly used for modern web applications.

The time has come to expand the review and provide several new options for people who are looking for the best pick for their new stylish ultrafast data intensive web applications.

We stand by the notion that web interfaces can be as flexible, feature-rich, and robust as their desktop analogues and should be considered as the first choice when choosing a platform for a user-facing application.

Modern data-intensive web applications are essentially web grids so it is extremely important to pick the best option among the many of them available. Our goal is to help you find the grid that powers your next application!

Contestants

We have previously reviewed many great grids and this time we wanted to introduce all new faces that weren’t tested before to give you a wider choice for your new shiny high performance web application!

The following grids are all excellent and you can’t go wrong by choosing any of them for your new project:

  • Tabulator 4.9: Their website says it is “The easy to use, fully featured, interactive table JavaScript library”. This is a simple, fast, and good looking grid with no external dependencies that is freely available under the MIT license.

Tabulator tableTabulator 4.9

  • FXB Grid: A grid without external dependencies that is simple to understand, and easy to extend, style, and modify. Also, spoiler alert, it is extremely fast!

FXB tableFXB Grid

Wijmo tableWijmo Grid 5.20203.766

  • RevoGrid 2.9.0: An Excel-like reactive grid that boasts support of huge data load and complex operations. While it is available as a pure JavaScript library, it is also providing bindings for most popular modern application frameworks such as React and Vue.

RevoGrid tableRevoGrid 2.9.0

  • Smart Grid 0.3.1: A lightweight highly customizable React grid. It’s very simple and not as feature-rich as other grids in this contest but it has great performance, and a very intuitive reactive interface. It can be a great low calorie open source alternative with only 884 bytes added to your final application bundle.

SmartGrid tableSmart Grid 0.3.1

  • SyncFusion DataGrid 18.4.39: A part of a gigantic SyncFusion component suite that spans through several languages and platforms. Perhaps, it is not the first choice for a standalone web grid project, but would definitely be a great addition that provides a highly efficient grid that delivers excellent performance in case you are already using other SyncFusion components for your applications.

SyncFusion tableSyncFusion DataGrid 18.4.39

If you want even more great options to consider for your project I would suggest reviewing our previous posts comparing many other great grids: Best Web Grids for 2020 and Grids Without Gridlock: Which is Fastest?

How We Test

Our main focus is user experience. The grid should look good, feel snappy, hold a huge amount of data and yet still go easy on memory as it often is a limited resource. A good grid shows results of a query with subsequent updates that occur to that grid, such as deletes, updates, and new records. On average, we used a message size of 140 Bytes– it’s big enough to show meaningful information and is small enough to fit millions of such messages into the grid without taking all the available RAM on our test system. The following set of tests should give us a good picture of how the selected grids will perform in a real world situation:

  • Rendering Time: How much time it will take to render the initial portion of data. Fast rendering is important so that the web application loads and is ready to work as soon as possible. Another situation when fast rendering might be useful is switching data sets to display in the grid.

  • Frames Per Second (FPS): The more FPS a grid can produce while being used, the smoother and more responsive it looks and feels. Significant changes in FPS are perceived as freezes and should be avoided as much as possible.

  • Memory Consumption: If a grid is memory efficient, it can work well and do more on a device with less memory, such as mobile devices and laptops. In our test we will measure how many rows/records a grid can render using no more than 2 GB of RAM.

  • Live Updates: Rendering the initial portion of data is important, but that’s not enough if a grid cannot smoothly render changes in real time. According to MDN, “A frame rate of 60fps is the target for smooth performance, giving you a time budget of 16.7ms for all the updates needed in response to some event.” In this test we will measure how many rows per second we can add to the grid while maintaining maximum FPS and experience no lagging.

Environment

Hardware
  • CPU: 6th Generation Intel® Core™ i7-6820HQ Processor (8MB Cache, up to 3.60GHz)
  • GPU: NVIDIA® Quadro® M1000M 4GB
  • RAM: 64GB DDR4 2133 MHz
  • Storage: 1TB PCIe SSD
Software
  • OS: Ubuntu 5.8.0-42 GNU/Linux x86_64
  • Browser: Google Chrome Linux 88.0.4324.150 (64-bit)

We don’t test other browsers as they are increasingly irrelevant at this point – they either have a tiny market share (Firefox), don’t have decent performance and support for modern technologies (IE 11), or are essentially clones of Chrome (Edge/Opera/etc).

Time to Render

Once the initial data portion of a query is loaded (typically, in a separate WebWorker, especially if it’s large), we need to display it in the grid. Considering the size of the initial portion, all grids did great, but one grid is a true king of rendering!

Grid Comparison: Rendering Time

Every grid in our tests is using virtualization. FXB Grid did fantastic, rendering pretty much any dataset in under a millisecond! SyncFusion and Smart Grid performed excellent as well. Other grids demonstrated a near linear dependency for the rendering time required which might be a limiting factor for extremely large datasets.

Rendering Performance in Dynamic: Scroll Tests

Now that we have our data loaded and rendered we want our grid to keep being responsive and snappy with all the data loaded. We want to look through these rows without having a feeling that we’re watching a slide show. To make this test more objective, we measured FPS using Chrome Developer Tools. Scrolling using Touchpad/Mouse wheel simulates slow scrolling, while scrolling by dragging the scrollbar will show how the grids are optimized for very fast scrolling. As before, we test for each dataset size.

Grid Comparison: Scrolling FPS -- Mouse / Touchpad

Grid Comparison: Scrolling FPS -- Scrollbar

Every grid nailed the mouse/touchpad scrolling test with buttery smooth near-perfect FPS! The scrollbar scroll, due to its nature, triggers more intensive re-renders of virtualized rows and thus can be somewhat more challenging which we observed in this case.

RevoGrid and FXB Grid are clear winners with RevoGrid having the best overall scrolling perfomance.

Wijmo and Smart Grid demonstrated decent performance which, while being slightly worse, would still provide great user experience. On the other hand, Tabulator seems to be not well optimized for this kind of re-rendering case and didn’t perform great.

SyncFusion is a special case – it felt snappy and smooth when using mouse/touchpad, however, it has a specific re-rendering behavior of lagging for about 200-300ms after scrolling using the scrollbar, exposing stale data previously populated in the virtual viewport before updating it (try to scroll the example on their website yourself). Because of that lag, we can’t award SyncFusion more than 3-5 frames per second for the scrollbar test.

Memory Efficiency

This is a test that answers one simple question – how much data can we display in the grid on an entry level desktop?

Memory Consumption

All grids demonstrated great efficiency – they will fit enough data before running out of memory, however, Smart Grid, SyncFusion, and FXB Grid are significantly more efficient when it comes to memory compared to the rest of the contestants.

Real Time Random Updates

Now the grid is loaded and rendered with all of the original data, but that’s not enough – without real-time updates, the dataset becomes irrelevant. This test starts with the 20,000 records and applies updates at an increasing rate, until the grid starts lagging.

Live Grid Updates

FXB Grid is excellent when it comes to real-time updates, more than 5 times outperforming the second place! Having said that, all contestants (except, perhaps, Tabulator) demonstrated decent performance when it comes dynamic data updates.

Quality of Documentation

While users care about performance and look-and-feel of a grid, developers care about how easy it is to work with the grid and implement application functionality with it. Let’s see what each grid engine can offer in terms of documentation, examples, and support.

I’ve ranked the grids as follows:

  1. Smart Grid– The grid is so simple, the documentation is just one small page. The simpler, the better, thus, the first place.

  2. Wijmo and SyncFusion– both grids provide tons of examples and live demos, API is very well documented and easy to search and navigate. Commercial support is available.

  3. RevoGrid– Nice, well structured documentation and examples. Commercial support is available.

  4. FXB Grid and Tabulator– Great documentation and interactive demos. Commerical support is available for the FXB Grid.

To be fair, all grids in this comparison have great documentation – the learning curve won’t be too steep!

Conclusion

We’ve reviewed an array of great web grids that will do great as a heart of your web application. In fact, this time test results demonstrated a much closer competition than a year ago for another set of contestants.

The winners among the newcomers are:

  1. FXB Grid: Excellent performance in every test – you simply can’t go wrong by picking this grid!

  2. Smart Grid: An ultralight and ultrafast React grid that will do the job without adding overhead.

  3. RevoGrid: A great grid engine with the smoothest rendering we’ve ever seen, with support for most frameworks, great documentation and available technical support for commercial customers.

Honorable mention: SyncFusion. this is a great pick in terms of performance, however it might not be the first choice if you’re not intending to build your entire application using their platform.

Our previous winners are also extremely nice grids to consider as well:

  • ag-Grid: An amazing grid engine that has every feature you can possibly imagine, along with great support, documentation and, of course, performance.

  • Webix: Excellent performance in all categories, great API and documentation.

Hopefully, these results can help steer you in the right direction of selecting the best web grid for your next project. Before you make the final decision, please also review our previous grid comparison posts: Best Web Grids for 2020 and Grids Without Gridlock: Which is Fastest?

For users who want to try these grids in action, we’ve prepared a GitHub repository with the sample projects for each grid used in the above tests. Did we miss something? Do you know a great grid we should totally try? Let us know what you think!

AMPS on Windows: WSL2 for Quick Development

$
0
0

Cartoon penguin sitting on a window holding the 60East logoAMPS is used for a wide variety of applications, from extreme low-latency applications with a latency budget of less than a millisecond roundtrip to applications that aggregate millions of fast changing records that intentionally conflate updates to reduce load on a user interface. All of these applications have one thing in common, though: AMPS runs on x64 Linux, so application developers need to have access to a Linux installation to develop against AMPS.

For sites (or developers) typically focused on Windows development, this can sometimes make it seem more difficult than necessary to get started with AMPS. Installing a virtualization product like VirtualBox or VMWare works well, but involves installing the virtualization software, choosing and manually installing a Linux distribution, and then dealing with what is effectively an entirely separate desktop and development system.

On recent builds of Windows 10, the process can now be just a few simple steps. These builds include Windows Subsystem for Linux 2 (WSL2), which runs a Linux kernel on Microsoft’s Hyper-V. It’s included as an optional feature of Windows 10 starting with the May 27, 2020 update (version 2004 / build 19041 and later). The Linux distributions are provided through the Windows Store, and are simple to download and install for people who don’t spend a lot of time managing Linux systems.

If you don’t already have an existing setup for running a Linux server on your windows system, WSL2 is a great solution. There’s no need to have a separate development system or to set up separate Virtual Machine software – you can do everything you need using the WSL2 system provided with Windows.

The advantages of running AMPS on WSL2 are the same as the general advantages of WSL2:

  • Good performance
  • An environment that is, effectively, identical to a native Linux install for Linux applications
  • Tight integration with the Windows environment
  • Easy installation and setup (especially as compared with installing Linux on a VM)

AMPS runs perfectly well on WSL2. All unit and integration tests pass on WSL2 (stress and long-haul-testing suites require several systems with high-speed networking between them, so those aren’t really run on any development system). In fact, AMPS (and the development environment for AMPS) run well enough that several members of the 60East development team now use WSL2 as their main development environment when working on the AMPS server.

AMPS On Windows: Step by Step

To set up WSL2 and get AMPS running, follow these steps:

  1. First, you need to make sure you’re running a version of Windows 10 that includes WSL2. As mentioned earlier, any version of Windows 10 more current than version 2004 / build 19041 will work. If you’re using an older version of Windows 10, you’ll need to allow a Windows feature update to get WSL2 running.

  2. Install WSL2. There are instructions in the Microsoft documentation for Installing WSL. In most cases, this boils down to the following command in an Administrator Powershell:

    PS C:\Users\yourname> wsl --install
    

    This installs an Ubuntu distribution by default. If you prefer to use a different distribution, the Installing WSL instructions include information on installing a different distribution. (In our experience, Ubuntu works quite well as a development environment.)

    To use WSL2 after installing it, you will need to restart your system.

  3. Optionally (but strongly recommended), you can set up other aspects of your development environment. Among other things, this lets you set a user name and password for the user that shells run under, and so on. You can find full WSL Environment Setup instructions in the Microsoft documentation.

  4. Install AMPS. This is a matter of downloading the latest release from the AMPS release page and then extracting it. Start the bash shell for your Linux distribution (if you’ve installed Ubuntu, you can run this by starting Ubuntu from the start menu) or Windows Terminal. Navigate to your home directory, then download and extract AMPS. You can use any current version of AMPS.

    For example, to install AMPS 5.3.3.30, you would run commands like:

    Navigate to your home directory:

    $ cd ~
    

    Download the AMPS binary:

    $ wget https://devnull.crankuptheamps.com/releases/amps/5.3.3.30/AMPS-5.3.3.30-Release-Linux.tar.gz
    

    Extract the AMPS binary:

    $ tar -zxf AMPS-5.3.3.30-Release-Linux.tar.gz
    
  5. Start AMPS. To start AMPS, just run the AMPS binary with a valid configuration file. To use the minimal configuration template included with the server, first have the server produce the configuration file and then start AMPS.

    In a bash shell or Windows terminal window, navigate to your home directory:

    $ cd ~
    

    Have the server produce the minimal sample configuration and save it to a file:

    $ ./AMPS-5.3.3.30-Release-Linux/bin/ampServer --sample-config > minimal.xml
    

    And then run AMPS, using that file as the AMPS configuration:

    $ ./AMPS-5.3.3.30-Release-Linux/bin/ampServer minimal.xml
    

    Depending on your Windows settings, you may get a warning from Windows firewall when AMPS starts. Check the appropriate boxes for the permissions you want AMPS to have.

That’s all it takes to get a minimal AMPS configuration up and running!

Tips for WSL2

You now have a running AMPS instance on your Windows system! If you’ve used the sample configuration, you can now open a browser on your Windows desktop and navigate to http://localhost:8085/ to see the Galvanometer for the instance.

A few useful tips:

  • Typically, AMPS will issue a few warnings on startup. The exact warnings depend on the distribution and version you chose for WSL2. The most common warning is that AMPS can’t determine the layout of the system for NUMA tuning. In a production system, it would be important to understand these warnings and determine if they need to be resolved. Since the WSL2 setup here is intended for interactive development rather than production, it’s generally alright to ignore these warnings and deal with any issues if they emerge.

  • For developing applications that will run on Linux, Visual Studio Code works well as a development environment. There’s an extension (the Remote - WSL extension) that provides excellent integration with the WSL2 environment.

  • If, at any point, you want to show the current directory in a File Explorer window, you can type explorer.exe . into the bash shell, and Windows will open that path in File Explorer. (This is also a convenient way to get the file path for things like uploading files from or saving files to the Linux environment.)

  • The WSL2 environment can host multiple AMPS instances, if necessary, to do development with a basic replication and failover scenario. (Of course, the more CPU-intensive processes you have running on the development system, the fewer resources are devoted to each process.)

  • There is a known issue with IPv4 over IPv6 networking in current builds of WSL2 (see the github issue ). This means that, if you are using a recent preview of AMPS and the Transport configuration for the server provides an InetAddr that only uses a port number (for example, <InetAddr>9007</InetAddr>, as the minimal sample does) then simply connecting to AMPS from Windows processes using localhost won’t work. To connect to the AMPS server from the Windows side in this case, you have a few different options:

    1. You can connect to AMPS over IPv6 (if you are using a current client library and a current preview version of AMPS). Rather than connecting using a string like tcp://locahost:9007/amps/json, connect over IPv6 using a string like tcp://[::1]:9007/amps/json.

    2. Explicitly bind the Transport to IPv4. To do this, you would change the InetAddr in the configuration to a value along the lines of <InetAddr>0.0.0.0:9007</InetAddr>, which will tell the AMPS server to listen on all IPv4 interfaces (but no IPv6 interfaces).

    3. Find the ethernet address of the WSL2 interface (using ip addr | grep eth0in the WSL2 bash shell) and connect using that IP rather than localhost. Unfortunately, this address may change if the system is restarted.

    For local development purposes, we generally take approach 1 or approach 2, since this can be set up once (in the application configuration file or the AMPS server configuration file) and then stay working.

Crank Up Your Windows!

Those of us who run Windows systems at 60East are big fans of WSL2. Although virtual machines work well, the ease of use and simple Windows integration make WSL2 enjoyable to work with. We hope that you’ll enjoy it too!

Have more tips or tricks when using WSL2? Drop us a line, or let us know in the comments!

AMPS Components and CVE-2021-44228 (log4j)

$
0
0

Image of a heavy combination lock on a safeOver the last several days, a remote code execution vulnerability (CVE-2021-4428) has been reported in the popular Apache log4j package.

This is an extremely serious vulnerability, and is being actively exploited by attackers as of the publication of this posting.


The AMPS server, the AMPS utilities, the AMPS client libraries, and supplemental Java components produced by 60East do not use log4j and are not vulnerable to this issue.

  • AMPS server The AMPS server does not use Java or the log4j product.

  • AMPS utilities The spark utility included with AMPS is written in Java, but does not use the log4j product.

  • AMPS Java client The AMPS Java client has no external dependencies outside of the Java Runtime Environment, and does not use the log4j product.

  • AMPS Java Kerberos authenticator This component is provided through a github repository, and is not included with the AMPS distribution or the AMPS client distribution. This example includes code that uses the Simple Logging Facade for Java. This example does not include log4j, but could be configured at deployment time to use log4j.

  • AMPS Apache Flume integration This component is provided through a github repository, and is not included with the AMPS server distribution or the AMPS Java client distribution. This component includes code that uses the Simple Logging Facade for Java. This example does not include log4j, but could be configured at deployment time to use log4j.

In summary, no Java code provided by 60East requires or uses log4j. It is possible for applications based on this code to use log4j. However, no modification to 60East-provided components or code is necessary to remove or update any use of log4j.

Which Message Type is Best For You?

$
0
0

Picture of a box of chocolates.From Day-1, we’ve built AMPS to be content aware, yet message-type agnostic. As such, we’re often asked which message-type we think is best. The best message type, in most situations, is dependent on the use-case. In this article, we drill-down into what factors you should consider when selecting a message type, the benefits/drawbacks of each message-type and the functionality trade-offs specifically when it comes to AMPS.

Message Type Considerations

There are a gazillion message types one could use, each having been created to offer some distinct benefit over other existing message types. For example, the FIX message type is used within financial services and is simple to parse, serialize, and view over a network. The Protobuf message type is designed to be a generic binary message type with a format enforced by a schema definition.

When selecting the best message type for your use case, it’s a good idea to consider the following: serialization, parsing, language support, and size.

Serialization and Parsing

Whatever format you select, messages will need to be serialized into that format. If your use-case is performance critical, then you’ll want to look at the serialization performance for the types of messages you’ll be sending. Make sure the programming languages your team uses has support for efficient serialization from data structures into the message format and parsing back into a data structure.

If you’re a performance critical use case, as many AMPS customers are, you’ll want to pay careful attention to any garbage collection or wasted cycles in the parsing path. For example, if you receive a 2KB message, is there an efficient way to get just a single value out of that message or does the entire message need to be parsed?

You’ll want to consider the full path from message construction (serialization) through to the consumption of that message (parsing) when determining which message type is the best fit for your use-case.

For example, general message formats such as Protobuf could be a great message type for a back-end system written in a variety of programming languages. However, if the final target of the message is a Javascript application running within a browser, then JSON is likely a better message type choice to optimize for the user experience, UI response time, and even battery lifetime (for mobile apps) – JSON was developed from the Javascript object model, and browsers have built-in parsers for JSON that are much more efficient than the parsers for any other format.

Message Size

Message types encode values and data types in different ways. You’ll want to make sure your message type choice has an acceptable data type “bloat” for the data types you plan using. For example, a message type like a simple “C-struct” or Protobuf message can efficiently encode a large array of 1000 double-precision floating point values in around 8000 bytes. However, using BSON or JSON could easily be 1.5x to 3x larger to store the same large array.

There can be a large variance on encoded data size between message types, so you’ll want to test the message types you are considering with the data you plan on using.

Message Type Properties

The 3 most important properties of message types are if the message type is “binary” (as opposed to utf-8, latin-1, ASCII, etc.), whether the type supports a hierarchical structure, and whether the type requires formal schema definition documents. Each property has unique benefits and drawbacks that can dramatically impact system performance, developer productivity, and future flexibility.

Intersecting capabilities diagram. Message types which are binary + hierarchical + use a schema: protobuf. Hierarchical + (optional) schema: xml. Hierarchical: JSON. Binary + hierarchical: BSON. Binary: BFLAT. Binary + schema: struct. Schema: nvfix, fix.

Binary Message Types

Message types that encode their data in binary form have a distinct advantage of being able to maintain the precision of their data. Message types that are encoded in UTF-8 or ASCII can lose floating point precision during serialization and parsing. If you need to transmit 64-bit floating point numbers without any loss of precision, then using a binary message type may be your only choice. On the other hand, if your data only needs a few decimal places of precision, then this loss of precision may not matter.

Hierarchical Message Types

Some message types work best for “flat” message layouts, while others are designed to work with hierarchical data. Hierarchical messages are, in our experience, more expensive (in time and space) to serialize and parse. If you’re using hierarchical messages, then you’ll typically be leveraging “array” data structures as well, which add to the complexity of your parsing and more surface area to your application testing. Some applications need a hierarchical structure to accurately represent the data. In other cases, though, a hierarchical structure isn’t necessary and using a flat (or flatter) data structure can improve performance.

Schema Definitions

When you application receives a stream of bits, it needs to understand the message framing and how to extract data from the message. Message types with schema support require the serialization into a specific format matching the schema that programs parsing the message can later use to determine the message layout. Messages without explicit schema definitions will have an implicit schema encoded in the message layout itself, otherwise a parser of the message won’t know which bits correspond to which data.

For example, schema-based Protobuf, can use the following schema definition for an Order:

messageOrder{int32id=1;int32quantity=2;floatprice=3;int32product_id=4;}

A single order will take 16-bytes on the wire and the receiver of the Order message will use the Protobuf schema (the .proto file) to decipher what those 16-bytes mean in terms of the Order properties.

On the other hand, if we were to send a similar message in a schema-less message type like JSON, the message could look something like the following:

{"id":1,"quantity":100,"price":123.45,"product_id":42}

It’s easy to see that the JSON message is much larger than 16-bytes, because the message schema/layout is encoded in each message itself.

Schemas are fantastic ways to reduce the size of messages, but they come at a cost with reduced system flexibility and developer agility. For example, adding a “timestamp” attribute to our Order example would require a new Schema is rolled-out to all producers and consumers of the message – otherwise a producer may be producing an older Order without a “timestamp” while a consumer expects the message to have a “timestamp” attribute. Compare that to JSON, where the producers can inject the new timestamp attribute at anytime and the consumer will see it and be able to use it when it exists.

Some teams see the schema-based types as too rigid and inflexible, while others see the fluidity of message types like JSON as having a dangerous lack of contract between the producers and consumers of the messages. There’s no single answer that works for all applications, but it’s important to consider the tradeoffs and be aware of what constraints you are choosing.

Message TypeSchemaBinaryHierarchical
JSON
FIX
XML
ProtoBuf
MessagePack
BSON
BFlat
C-Structs

⬤: Full Capability ◍: Partial Capability ○: No Capability

End-to-end Performance

One of the reasons we’ve built AMPS to be message type agnostic, is because we’ve found in decades of working on high-performance systems, that one of the most common places to unnecessarily introduce latency is message type conversions.

For example, if you’re storing FIX data into a classic RDBMS you need to convert the FIX data into SQL insert statements that map the FIX data to columns within the database table. If you want to later read that record and format into JSON, you need to select the data out and then convert into JSON.

Even in cases where the message type of the producer and consumer are the same, if the intermediary data store or broker requires a different data format, then you’ll add latency to your messaging with conversions alone.

Extracting values from a message to store them in a tabular format, only to then reassemble them into the same serialized format, increases latency.

When your datastore or broker can natively store data in at least the producer or consumer’s format, this can cut down the latency costs by 1/2. If the datastore or broker, producer, and consumer can all natively use the same format, then there’ll be no latency increase due to format conversions.

Therefore, an additional consideration for your message type selection should be the intermediary systems that these messages pass through. Make sure you can store, query, and retrieve data in your message type of choice.

AMPS and Message Types

We’ve worked hard to make the message type you select to use with AMPS a choice of functionality and policies of your choosing. This is reflected in our messaging performance, which at a 10% match rate you can see the content filtered performance of every message type is outstanding – maxing out at nearly 1 million messages per second per CPU core for every message type (except for that darn XML – which is, unfortunately, both complex and verbose!) The graph below shows the results with relatively small messages, using content filtering with a 10% match rate, and running on a relatively fast (as of March 2022) machine.

Since AMPS is message type agnostic, message types all perform close to or slightly above 1 million messages/second per CPU core -- except for XML, which is somewhat slower, though still above 800K messages/second per CPU core.

AMPS is designed to let you choose which message type works best for you. Even better, there’s no need to be restricted to the list of message types provided with AMPS, because we have APIs for extending AMPS functionality and content-awareness to other message types. This means we (or customers) can include new message types without changing the AMPS server itself.

Most functionality is supported on every type that ships out-of-the-box with AMPS. However, there are key differences with Protobuf when it comes to delta messaging (you need to be using Protobuf version 2 or greater than 3.15) and with real-time aggregation. Real-time aggregation doesn’t work with strict schema data types, since it’s not necessarily possible for AMPS to guarantee that the aggregation is valid for the schema (except for within real-time aggregated JOINs that have a result message type in one of the other message types supporting real-time aggregation.)

AMPS Message Type Content Filtering Delta Messaging Realtime Aggregation
JSON
FIX
XML
ProtoBuf
MessagePack
BSON
BFlat
C-Structs
“Unparsed Binary”

⬤: Full Capability ○: No Capability

Still Struggling?

Hopefully these considerations help with selection of the best message type for your application or solution space. If you’re still struggling with what to choose, then we’d suggest these tips:

  • Web/mobile applications are increasing in popularity: go with JSON if you can.

  • If you’re always in a high-frequency feedback loop with your own users/customers, select a flexible (non-schema) message type, such as JSON or MessagePack.

  • Minimize data hierarchy within your messages (the “flatter” the better) – go at most one level beyond the “root” level.

  • For serialization and parsing performance, don’t ever use XML or BSON.

  • If you have the choice of which fields to include in your messages, include fewer fields for better performance.

Reloaded: Monitor Your AMPS Instances with Prometheus and Grafana

$
0
0

a light bulb with Earth as a light source

This post updates one of our most popular blog articles

We wrote this several years ago, and it remains true: modern data processing systems are complex and often consist of several sub-systems from various vendors where each individual subsystem typically exposes some sort of monitoring interface with its own metrics, format, authentication and access control. In order to keep such complexity under control and be able to monitor whole system state in real-time and in the past, standard monitoring packages have emerged. More than ever, most customers we work with no longer build end-to-end monitoring systems themselves, but instead build custom dashboards using off-the-shelf monitoring software. It makes sense to focus on the metrics that are important to the business and the application rather than the low-level details of creating the framework.

One popular package is Prometheus. Prometheus is an open-source product created to collect and aggregate monitoring data and stats from different systems in a single place. Prometheus conveniently integrates with Grafana, another open source tool that can visualize and present monitoring stats organized in dashboards. In this post, we demonstrate how to integrate the built-in AMPS Admin API with Prometheus, and thus, with Grafana in order to monitor and visualize various AMPS metrics.

To integrate AMPS data into Grafana, we’re going to need to do a few things:

  • configure AMPS Admin API
  • create a data exporter that exposes data from AMPS Admin API in a format recognized by Prometheus
  • configure Prometheus to use the AMPS data exporter
  • configure Grafana to use Prometheus as a data source

As usual, all of the files used in this article are available on Github.

If you’ve never worked with Prometheus or Grafana before, you can find detailed quick start guides here:

Configure AMPS Admin API

AMPS has a built-in Admin module that provides metrics using a RESTful interface. All it takes to enable the monitoring and statistics interface is to add the Admin section in the AMPS configuration file:

<AMPSConfig>
    ...

    <Admin><InetAddr>8085</InetAddr><FileName>stats.db</FileName><Interval>1s</Interval></Admin>

    ...
</AMPSConfig>

If your configuration already has the Admin API enabled, just take note of the port number used for the Admin API.

Otherwise, you can simply add the Admin section that exposes the Admin API at the specified URL (http://localhost:8085) and also stores stats in a file (stats.db)

Once you’ve prepared the configuration file, start AMPS. The full configuration file for the demo is available on Github for your convenience.

The detailed description of every metric AMPS provides is available in the Monitoring guide here.

Plan Data Collection

AMPS offers a wide variety of metrics, and not all metrics will be useful for every installation. (For example, although there is a lot of information about message queues available, those metrics aren’t useful for applications that use a fan-out messaging pattern rather than using message queues for compettitive consumption).

In the updated sample dashboard, we include basic metrics for:

  • Host level load
    • Memory
    • I/O
    • Disk usage
    • CPU load
  • Instance level metrics
    • Overall incoming messages by processor type
  • Metrics for topics in the SOW (including views and queues)
    • Insert, update and delete counts (numbers since AMPS started)
    • Insert, update, query, and delete counts per second (averaged over each sample interval)
  • Metrics for views
    • Number of in-flight updates for each view
  • Metrics for queues
    • Age of oldest message in the queue
    • Current queue depth
    • Replication-related statistics
  • Metrics for replication destinations
    • Connection state (currently connected or not)
    • Transaction log replay point for this destination (seconds_behind)
    • Messages sent per second (averaged over each sample interval)
  • Metrics for client connections
    • Bytes in and out per second (averaged over each sample interval)
    • Network buffer metrics (for both send and receive buffer)
    • Messages buffered in AMPS for this client (oldest message and current count)

These metrics provide a general-purpose minimal dashboard for AMPS. We encourage you to use this as a starting point. Remove any statistics that don’t make sense for your installation, and add any statistics that are important for your application and environment.

Create an AMPS data exporter for Prometheus

In order to add AMPS monitoring stats to Prometheus we will need a custom exporter. Exporters are applications that convert monitoring data into a format recognized by Prometheus. The detailed guide on how to write Exporters is available here. Depending on the language you want to use you might utilize one of the official client libraries available here. In our demo, we will be using Python since Python is simple to use and allows us to focus on the exporter’s logic. As with the configuration file, all the files mentioned in this section are in github.

Now we’ll need to create the exporter application that you can run as a python app.

First, make sure you’ve installed the dependencies for the Prometheus client:

pip install requests prometheus_client

Our exporter will need a custom collector – a special class that collects data from AMPS upon receiving a scrape event from Prometheus:

fromprometheus_client.coreimportGaugeMetricFamilyimportrequestsclassAMPSCollector(object):defget_stats(self):"""    This method collects stats from AMPS at the moment     of the scrape event from Prometheus. It can also     handle all the required authentication / custom HTTP     headers, if needed."""returnrequests.get('http://localhost:8085/amps.json').json()defcollect(self):# load currents stats from AMPS firststats=self.get_stats()# update the metrics -- add# whichever metrics you need to# monitor here.yieldGaugeMetricFamily('amps_instance_clients','Number of currently connected clients',value=len(stats['amps']['instance']['clients']))yieldGaugeMetricFamily('amps_instance_subscriptions','Number of currently active subscriptions',value=len(stats['amps']['instance']['subscriptions']))yieldGaugeMetricFamily('amps_host_memory_in_use','The amount of memory currently in use.',value=stats['amps']['host']['memory']['in_use'])# The repository has more metrics with more# advanced collection -- check it out!

To add an exposed metric, we use a GaugeMetricFamily object. For example in the above sample we expose the metric amps_instance_clients that corresponds with the number of Client objects reported in the Admin API at the /amps/instance/clients path.

Most AMPS metrics can use the gauge metric type since it’s a simple value that can be set at each interval. You can read more about Prometheus metrics types here.

The collector class only has a single required method – collect(). The collect() method is called upon a scrape event. Once called, the method is responsible for populating metrics values which are gathered from AMPS via a simple GET request to the AMPS Admin API. We request data in the JSON format by adding .json at the end of URL since JSON is easily convertible into native Python lists and dictionaries.

Second, we need to register our AMPS collector within the Prometheus client:

fromprometheus_client.coreimportREGISTRYREGISTRY.register(AMPSCollector())

Finally, we start the HTTP server supplied by the client that will serve the exporter’s data:

fromprometheus_clientimportstart_http_serverimporttimeif__name__=='__main__':# Start up the server to expose the metrics.start_http_server(8000)# keep the server runningwhileTrue:time.sleep(10)

The above code uses a custom collector to properly request data from AMPS and expose it to Prometheus at the moment of a scrape event. Depending on the policies at your site, you might modify the get_stats() method to add authentication / entitlement handling, if needed. More information about securing AMPS Admin API is available here.

Start the exporter application and it will expose an HTTP interface at localhost:8000 for Prometheus to scrape:

python amps-exporter.py

That’s it: our custom exporter is complete!

For more details on the Prometheus Python client, see the manual, available here.

Configure Prometheus to use the AMPS data Exporter

Now we need to configure Prometheus to utilize the new scrape target (that is, the service provided by the exporter) that we just created. To do this, add a new job to the configuration file:

global:# Set the scrape interval to every 10 seconds. # Default is every 1 minute.scrape_interval:10sscrape_configs:-job_name:'amps_stats'# Override the global default # and scrape targets to every 1 seconds. # (should match AMPS > Admin > Interval settings)scrape_interval:1sstatic_configs:-targets:['localhost:8000']labels:group:'AMPS'

In the above example, we add the job and also override the scrape_interval value to match the AMPS Admin statistics interval value we set in the first step. Since that’s the interval at which AMPS refreshes statistics, it’s not especially useful for Prometheus to ask for statistics on a more frequent interval (though if the visualization does not need to be as granular as the statistics interval, it could be reasonable to ask for statistics less frequently).

We set the `scrape_interval at the job level since several AMPS instances can be monitored, and each instance might have a different statistics interval.

Once configured, Prometheus can be started with this configuration file:

./prometheus --config.file=prometheus.yml

That’s all it takes to start collecting AMPS statistics into Prometheus!

Configure Grafana to use Prometheus as a data source

Of course, statistics are more useful if there’s a way to visualize them. That’s where Grafana comes in.

Once the data is in Prometheus, adding it to Grafana is straightforward. Navigate to Grafana and add Prometheus as a Data Source. The detailed instructions on how to do this are available here.

The only setting you’ll need to modify for our example is the URL: http://localhost:9090. After the data source is added, building the dashboard is pretty straightforward – you can choose different graphs, thresholds and re-arrange widgets on the page.

In this version of the dashboard, we show results for the mertics discussed above.

Here’s a screenshot of the dashboard:

AMPS Grafana Dashboard with metrics displayed

The dashboard is included in the github repository.

To Infinity and Beyond!

In this post, we’ve just scratched the surface of how the AMPS Admin API can be integrated with Prometheus and Grafana. Many additional metrics are available and there are a wide variety of ways those metrics can be visualized. Since Prometheus can collect data from a wide variety of sources, you can also combine data on the AMPS instance with data about other parts of the application, giving you full end-to-end monitoring.

For further reading, here are some more articles about AMPS monitoring:

Have a recipe that isn’t listed here? Know a great trick for monitoring AMPS with Prometheus, or have a cool technique that isn’t mentioned here? What dashboard would you build? What other systems would you monitor together with AMPS?

Let us know in the comments!

Viewing all 62 articles
Browse latest View live